February 8, 2018
While we study many of the stocks, how can we miss Apple? See the analysis below for learning.
US Stock Analysis
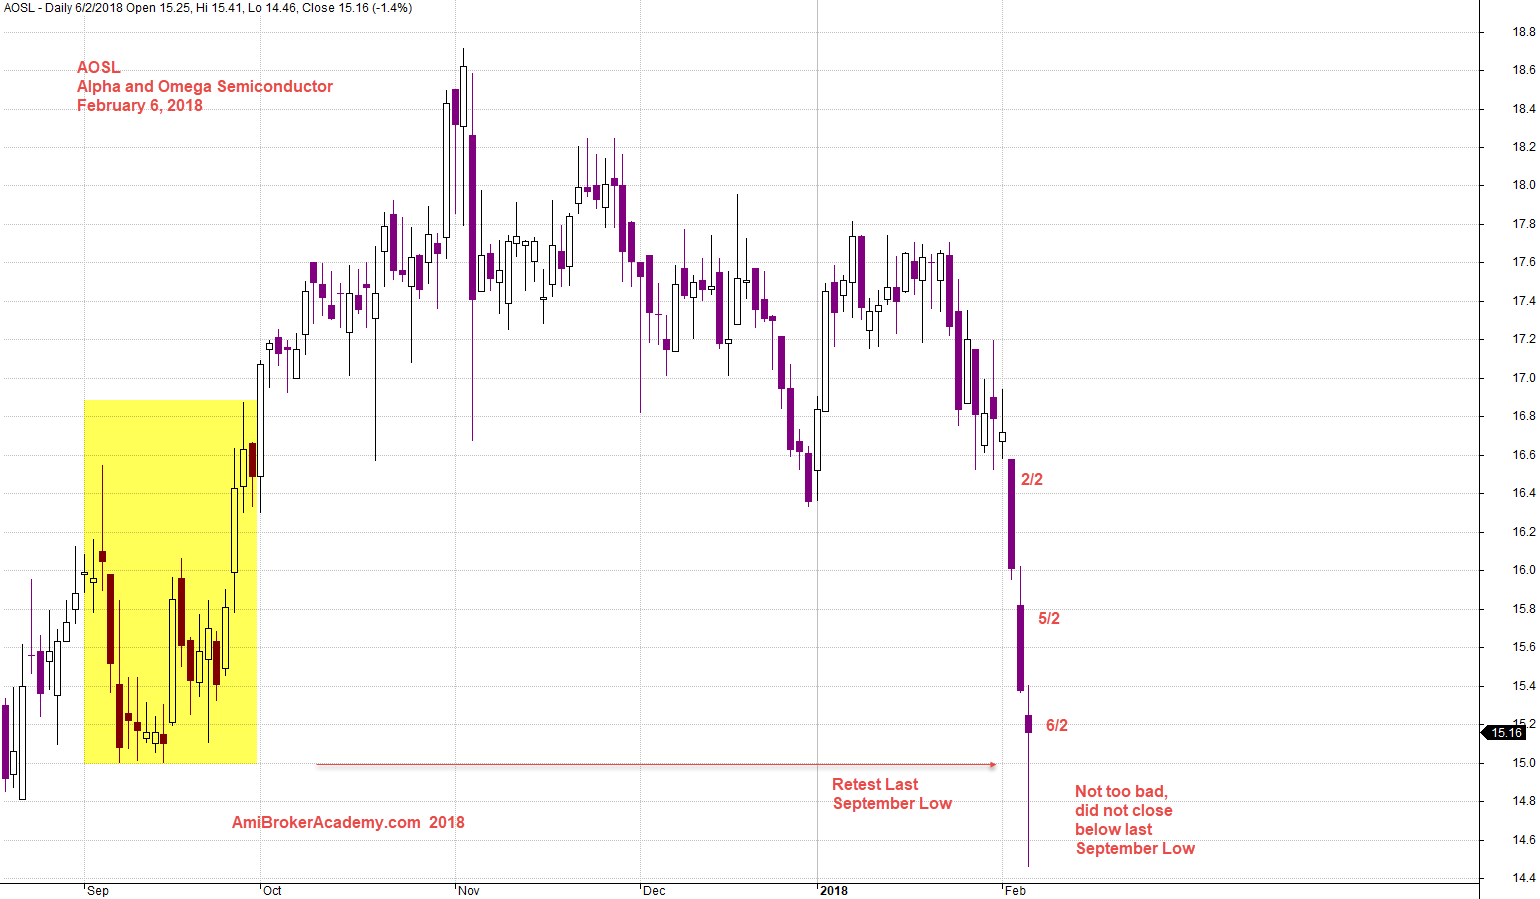
AOSL Alpha and Omega Semiconductor Charting
See chart, for Alpha and Omega Semiconductor the sell off low results was lower than last September low.
The four months hard work has just over in three days. So, the bottomline is if you know the technique trade just this three days and rest for four months. This is better than those five hours week book.
Manage your risk!
Powerful Chart Software – AmiBroker
The following chart is produced using AmiBroker charting software. It is a powerful chart software. You plot the stocks you are interested all in one chart, as long as you still could read them. See chart below.
February 6, 2018 Alpha and Omega Semiconductor Charting
Moses
AmiBrokerAcademy.com
Disclaimer
The above result is for illustration purpose. It is not meant to be used for buy or sell decision. We do not recommend any particular stocks. If particular stocks of such are mentioned, they are meant as demonstration of Amibroker as a powerful charting software and MACD. Amibroker can program to scan the stocks for buy and sell signals.
These are script generated signals. Not all scan results are shown here. The MACD signal should use with price action. Users must understand what MACD and price action are all about before using them. If necessary you should attend a course to learn more on Technical Analysis (TA) and Moving Average Convergence Divergence, MACD.
Once again, the website does not guarantee any results or investment return based on the information and instruction you have read here. It should be used as learning aids only and if you decide to trade real money, all trading decision should be your own.