July 25, 2017
The Background and Experience
^IXIC US NASDAQ Composite Index and 34 MA Band
See chart for more, picture worth a thousand words.
US NASDAQ Index is bouncing above MA, the 34 MA band. Although I has cross below the 34 MA band but cross back up again. And it breakout higher than the last high.
Bullish, the the chart show bullish trend.
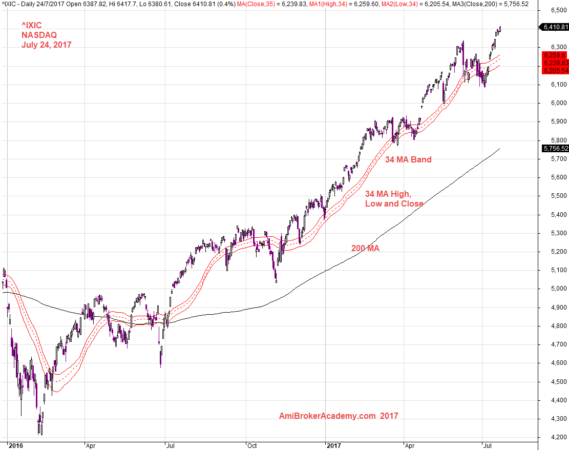
July 24, 2017 NASDAQ and 34 MA Band
Slopping Up ^IXIC NASDAQ Index and Channel
Channel slopping from bottom left to top right. Bullish bias. Picture worth a thousand words. See chart for more.
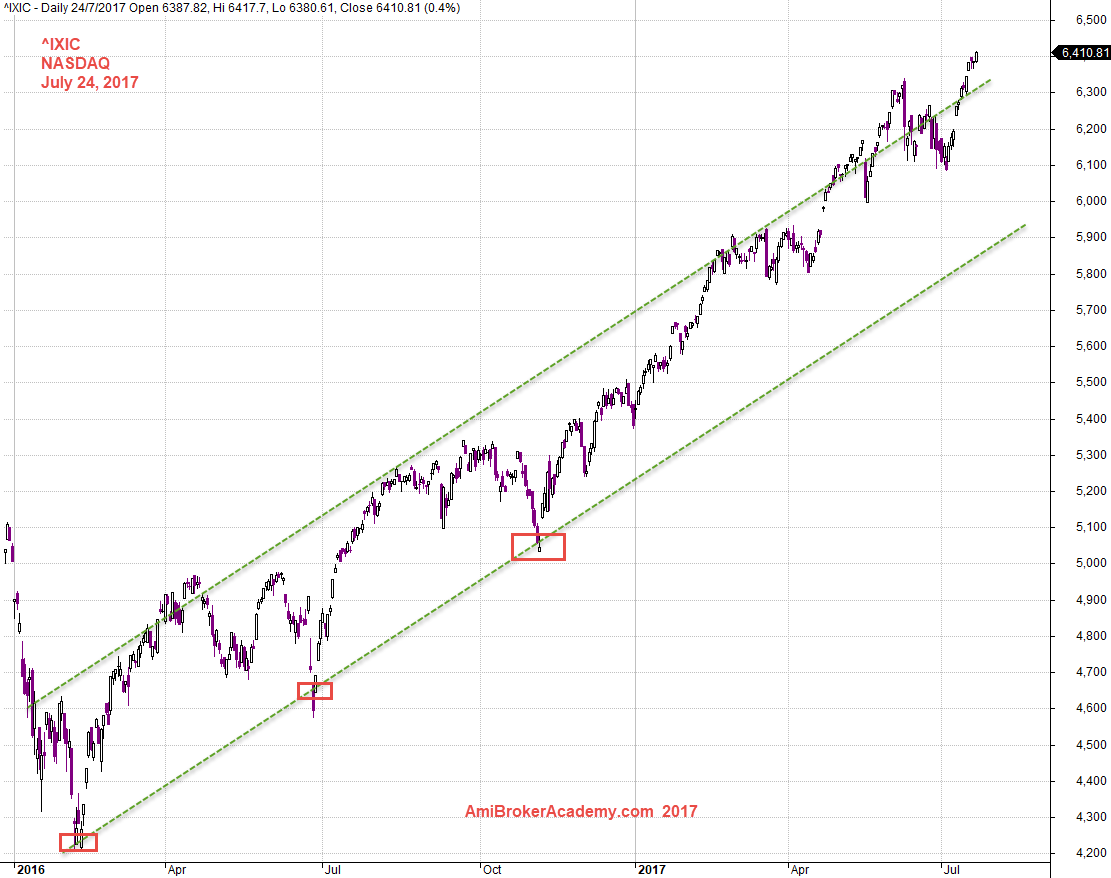
July 24, 2017 NASDAQ Index and Channel
^IXIC NASDAQ Index and MACD
After we study the NASDAQ Index using channel, moving average, 34 MA band and now let’s see it from MACD indicator point of view.
What can you get from the chart?
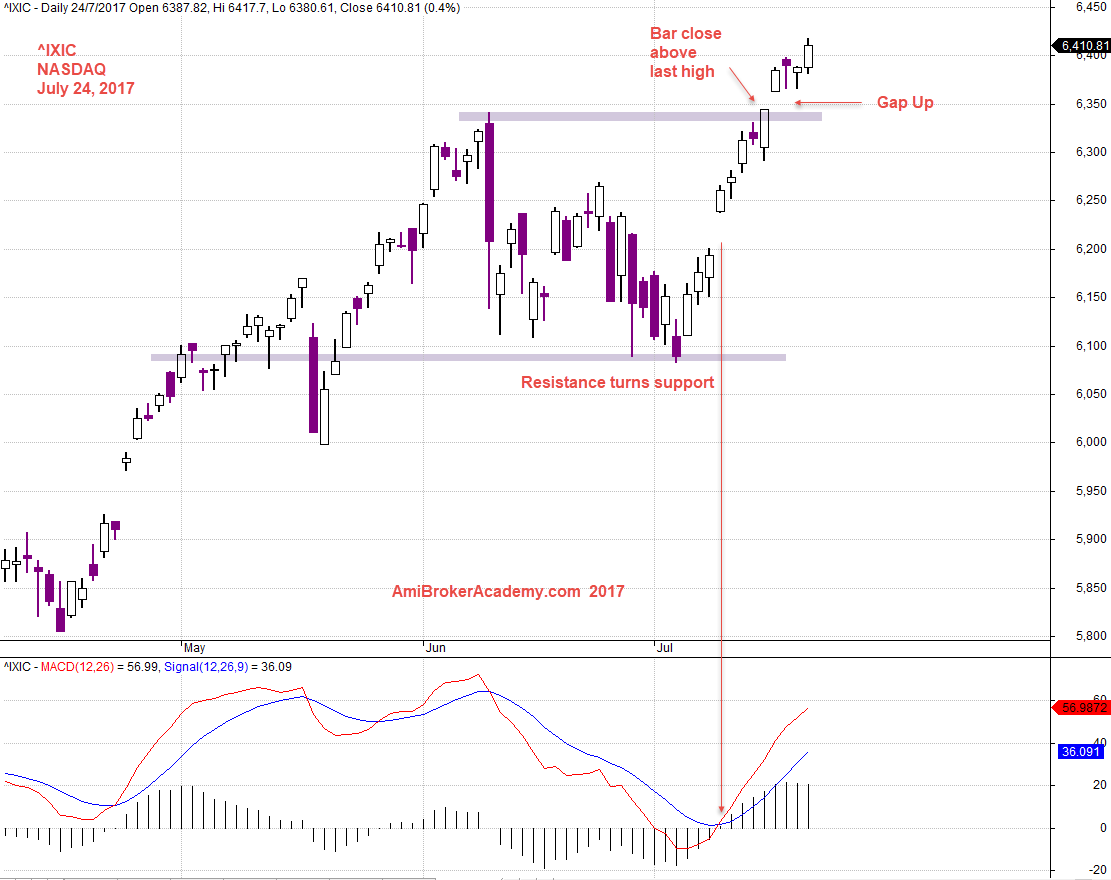
July 24, 2017 NASDAQ Index and MACD Signals
Thanks for visit the site here. You could also find free MACD scan here in this site too.
Moses
AmiBrokerAcademy.com
Disclaimer
The above result is for illustration purpose. It is not meant to be used for buy or sell decision. We do not recommend any particular stocks. If particular stocks of such are mentioned, they are meant as demonstration of Amibroker as a powerful charting software and MACD. Amibroker can program to scan the stocks for buy and sell signals.
These are script generated signals. Not all scan results are shown here. The MACD signal should use with price action. Users must understand what MACD and price action are all about before using them. If necessary you should attend a course to learn more on Technical Analysis (TA) and Moving Average Convergence Divergence, MACD.
Once again, the website does not guarantee any results or investment return based on the information and instruction you have read here. It should be used as learning aids only and if you decide to trade real money, all trading decision should be your own.