May 15, 2017
If you are a pattern guy, you will always looking out for pattern resembling the past and bet the history will repeat itself. As we are all human being, we remember.
Can DJI and NASDAQ Fail 2017?
It is just too high to be imagine the market are so good.
United States History at a Glance
We refer to the United States Stock History, when you look at to year 2000. The stock markets were rocket high and what happen. To draw a lesson from the history, it is not suggesting you make huge money from this but to be careful you can be trapped with the bullishness.
Study the chart for more, picture worth a thousand words.
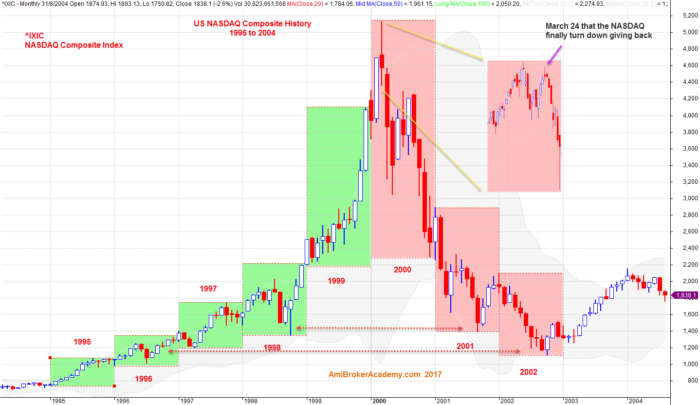
May 14, 2017 NASDAQ Composite Index History 1995 to 2004
NASDAQ Composite Index
Remember, all setup can fail.
Moses Stock Analysis
AmiBrokerAcademy.com
Disclaimer
The above result is for illustration purpose. It is not meant to be used for buy or sell decision. We do not recommend any particular stocks. If particular stocks of such are mentioned, they are meant as demonstration of Amibroker as a powerful charting software and MACD. Amibroker can program to scan the stocks for buy and sell signals.
These are script generated signals. Not all scan results are shown here. The MACD signal should use with price action. Users must understand what MACD and price action are all about before using them. If necessary you should attend a course to learn more on Technical Analysis (TA) and Moving Average Convergence Divergence, MACD.
Once again, the website does not guarantee any results or investment return based on the information and instruction you have read here. It should be used as learning aids only and if you decide to trade real money, all trading decision should be your own.