May 6, 2017
UOB Led ST Index to breakout 3200 Points.
Picture worth a thousand words. See the line chart below, the UOB and STI.
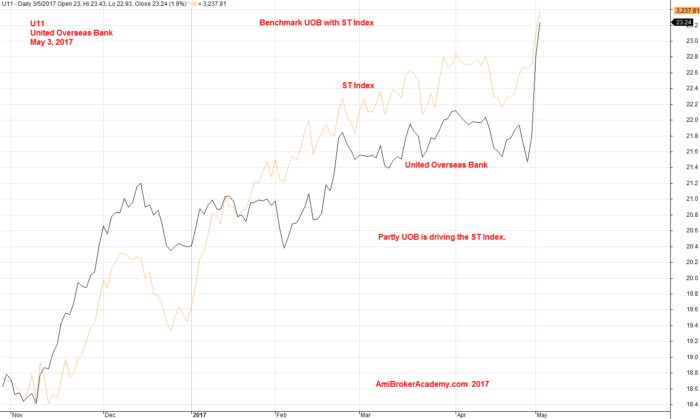
May 3, 2017 United Overseas Banking and ST Index Benchmarking
UOB and EMA – 34 EMA Wave
Price action is bouncing above MA. MA is slopping from the bottom left to the top right, bullish trend.
34 EMA wave is pointing at one o’clock direction.
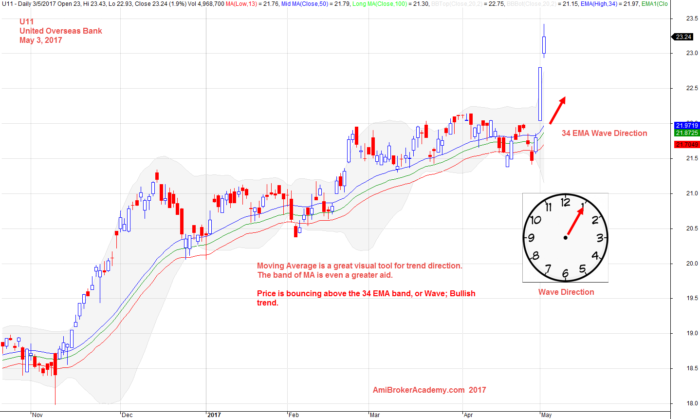
May 3, 2017 UOB and 34 EMA Wave
UOB Breakout Above the Resistance
It takes two three months for the price to breakout above the resistance, see chart. This will be a powerful one breakout, even if this is a very emotional one. The price jump up from 22 dollars to 23 dollars..
Watchout.
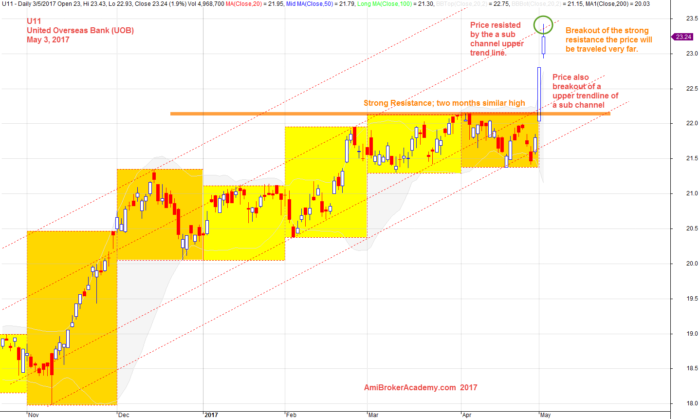
May 3, 2017 United Overseas Bank and Support Resistance
3200 Points Level Straits Times Index Two Years High
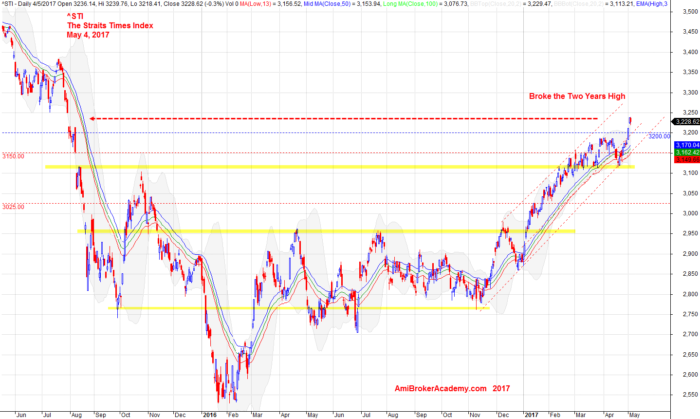
May 4, 2017 Straits Times Index Broke the Two Years High
Moses Stock Analysis
AmiBrokerAcademy.com
Disclaimer
The above result is for illustration purpose. It is not meant to be used for buy or sell decision. We do not recommend any particular stocks. If particular stocks of such are mentioned, they are meant as demonstration of Amibroker as a powerful charting software and MACD. Amibroker can program to scan the stocks for buy and sell signals.
These are script generated signals. Not all scan results are shown here. The MACD signal should use with price action. Users must understand what MACD and price action are all about before using them. If necessary you should attend a course to learn more on Technical Analysis (TA) and Moving Average Convergence Divergence, MACD.
Once again, the website does not guarantee any results or investment return based on the information and instruction you have read here. It should be used as learning aids only and if you decide to trade real money, all trading decision should be your own.