October 7, 2017
UBS AG and Strong Level
Picture worth a thousand words, see chart. Can the strong level resists the price action from breakout higher? Will see.
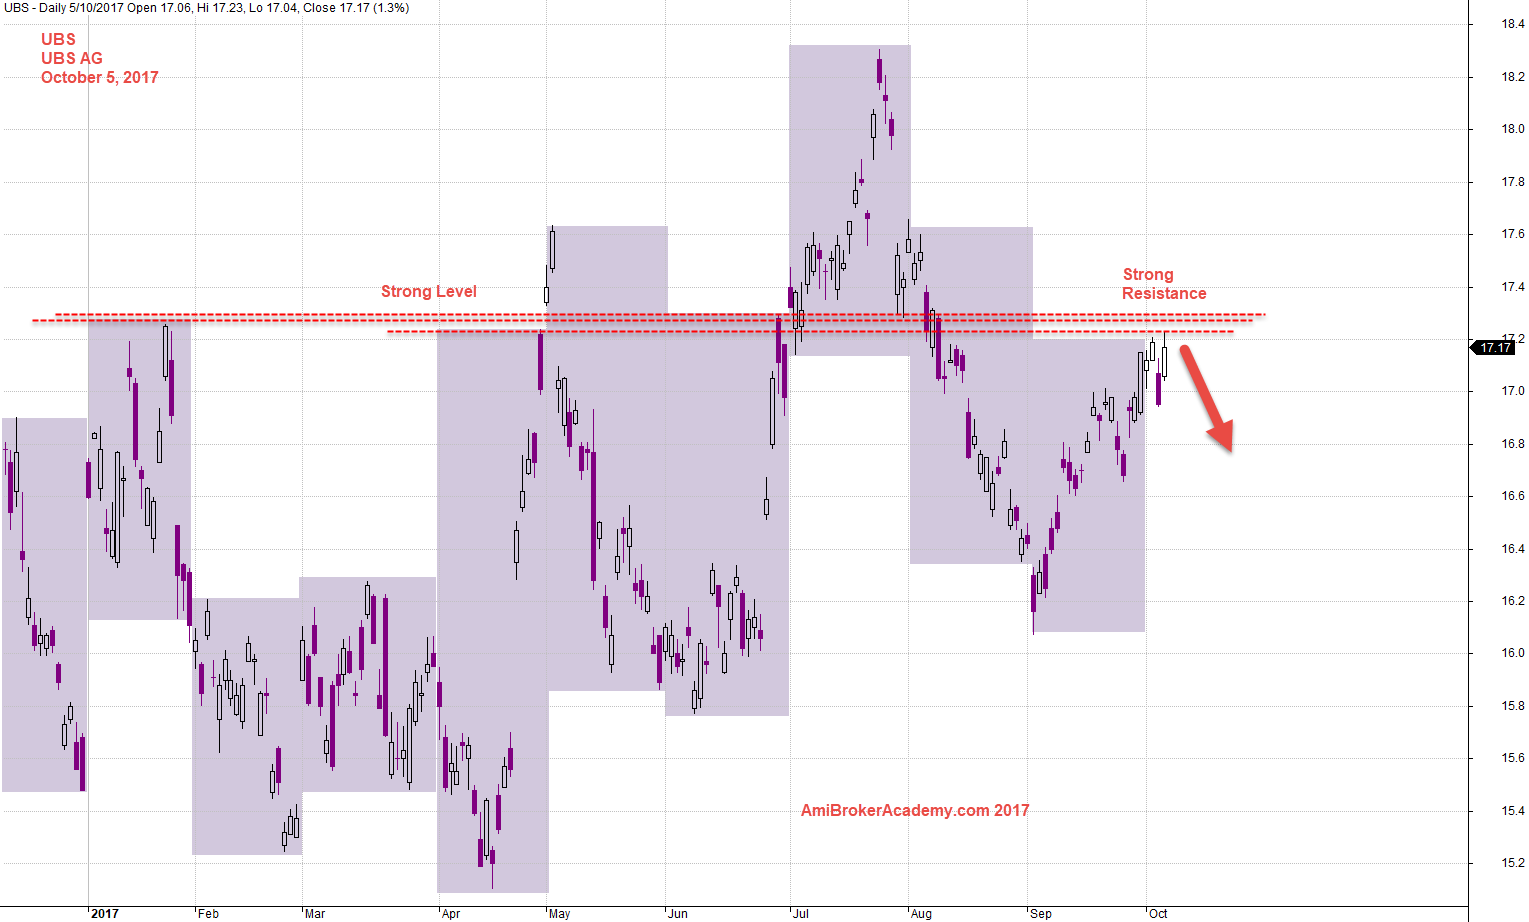
October 5, 2017 UBS AG and Strong Level
UBS AG and Read Bar by Bar
Picture worth a thousand words, see chart. From the bar by bar, the momentum seem to be bouncing high. So, what now? If chart gives you different view, just wait lah (Singlish, Singapore English). Wait until the trend direction is much clearer. Okay?
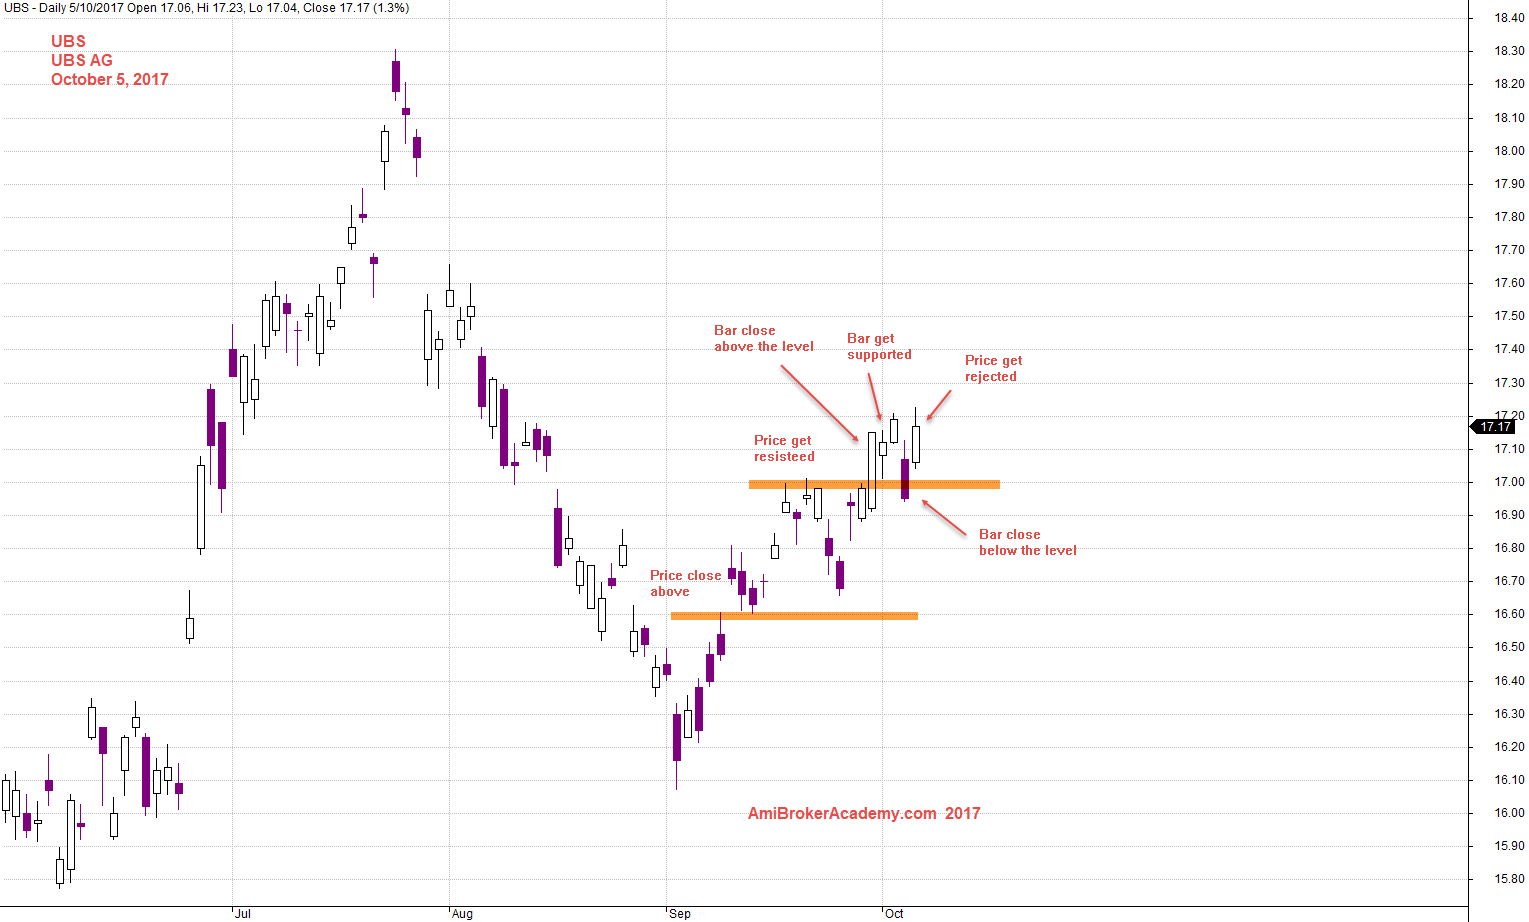
October 5, 2017 UBS AG Bar by Bar
UBS AG and Channel
Picture worth a thousand words, see chart.
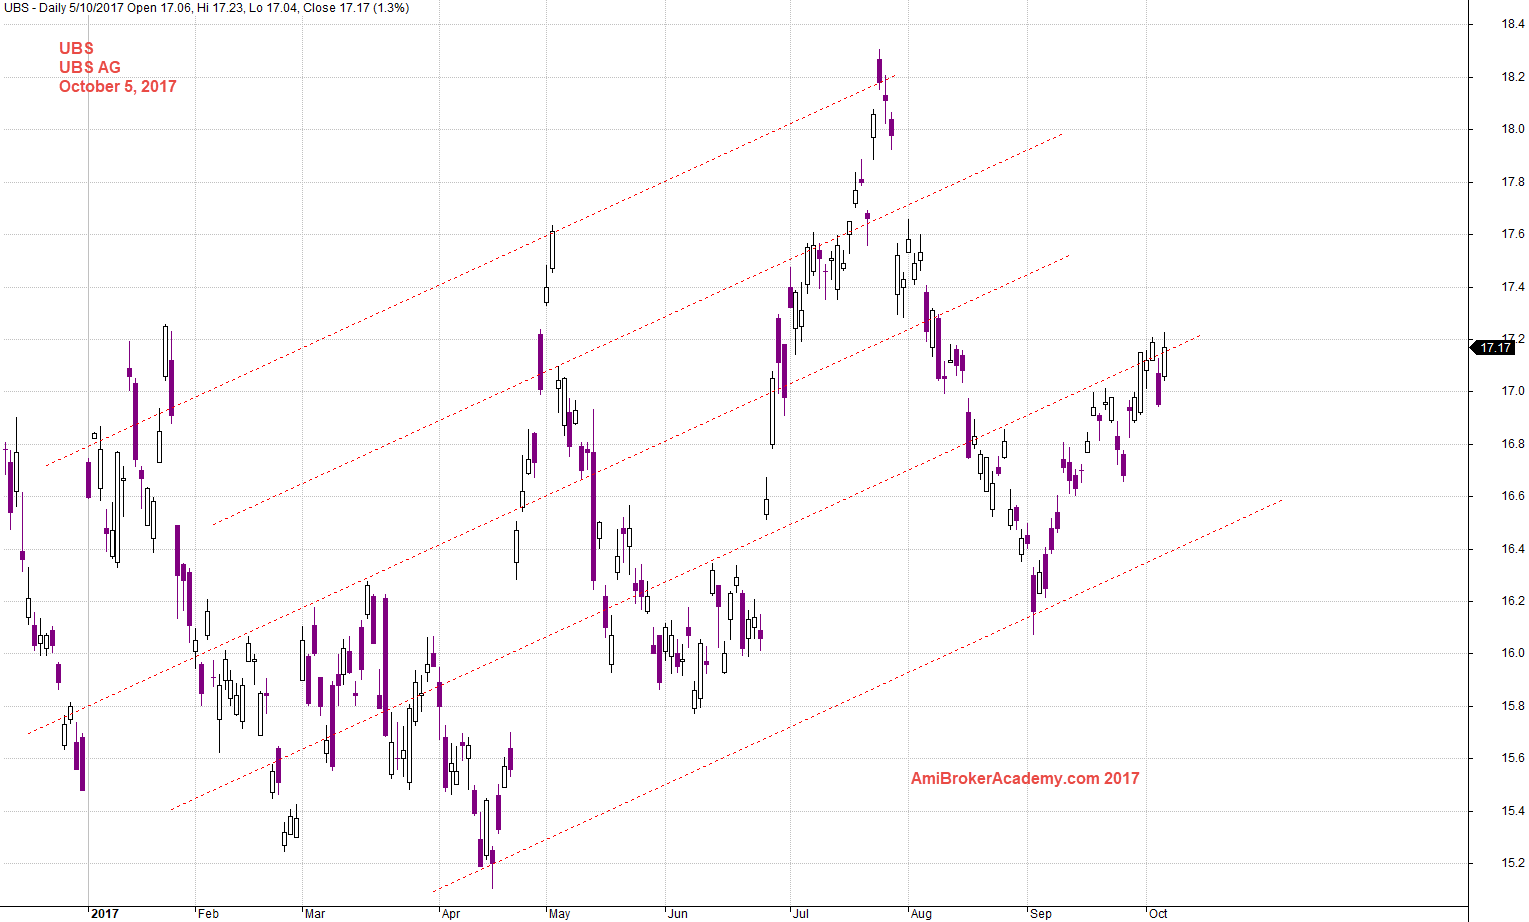
October 5, 2017 UBS AG and Channel
UBS AG and Channel
Picture worth a thousand words, see chart. This charting is very bearish, if the turning is happening. Will see.
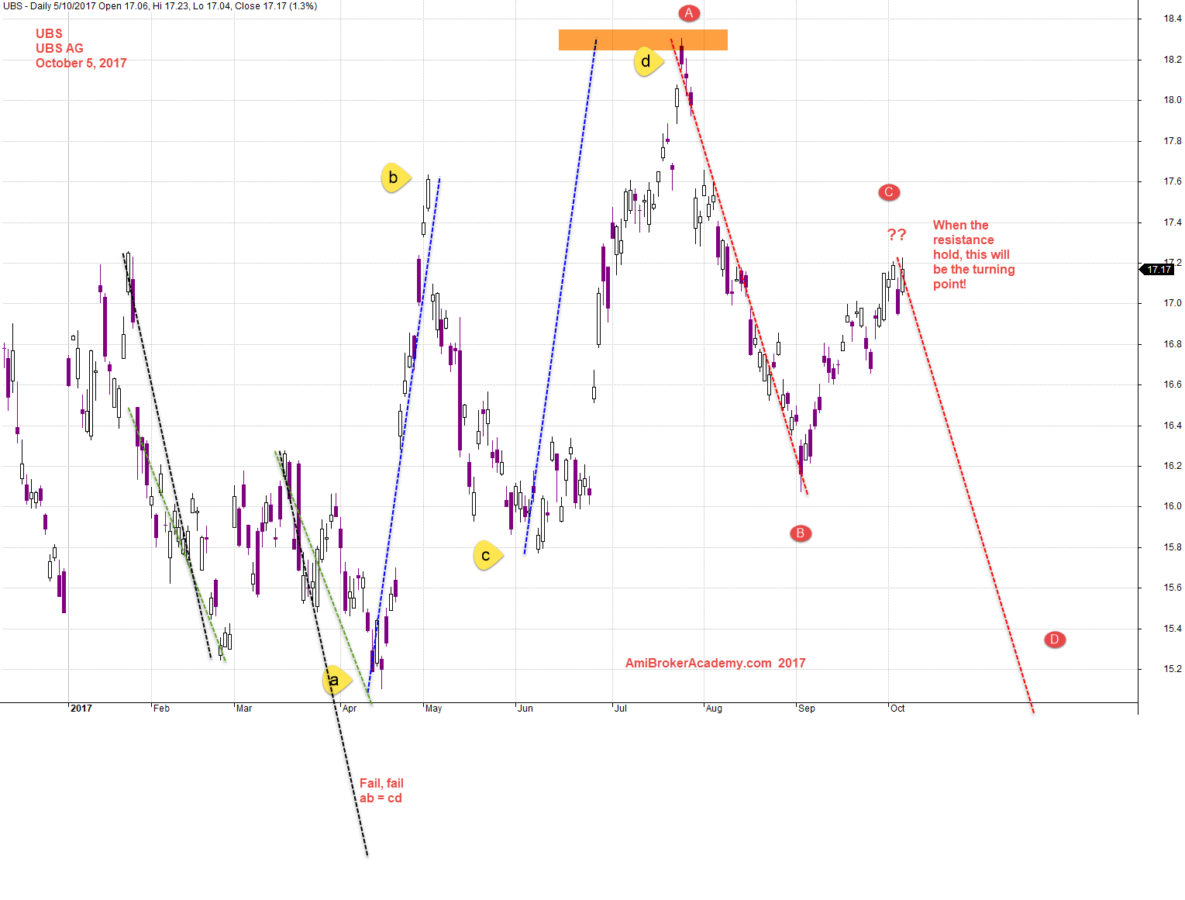
October 5, 2017 UBS AG and Gartley ABCD Pattern
Moses
AmiBrokerAcademy.com
Disclaimer
The above result is for illustration purpose. It is not meant to be used for buy or sell decision. We do not recommend any particular stocks. If particular stocks of such are mentioned, they are meant as demonstration of Amibroker as a powerful charting software and MACD. Amibroker can program to scan the stocks for buy and sell signals.
These are script generated signals. Not all scan results are shown here. The MACD signal should use with price action. Users must understand what MACD and price action are all about before using them. If necessary you should attend a course to learn more on Technical Analysis (TA) and Moving Average Convergence Divergence, MACD.
Once again, the website does not guarantee any results or investment return based on the information and instruction you have read here. It should be used as learning aids only and if you decide to trade real money, all trading decision should be your own.