December 28, 2017
Singapore Stock Analysis
U96 Sembcorp Industries and Level
After fail to breakout higher at 3.45, the price fall back down again. The price action fall through 3 dollars. See chart for more.
Powerful Chart Software – AmiBroker
The following chart is produced using AmiBroker charting software. It is a powerful chart software. You plot the stocks you are interested all in one chart, as long as you still could read them. See chart below.
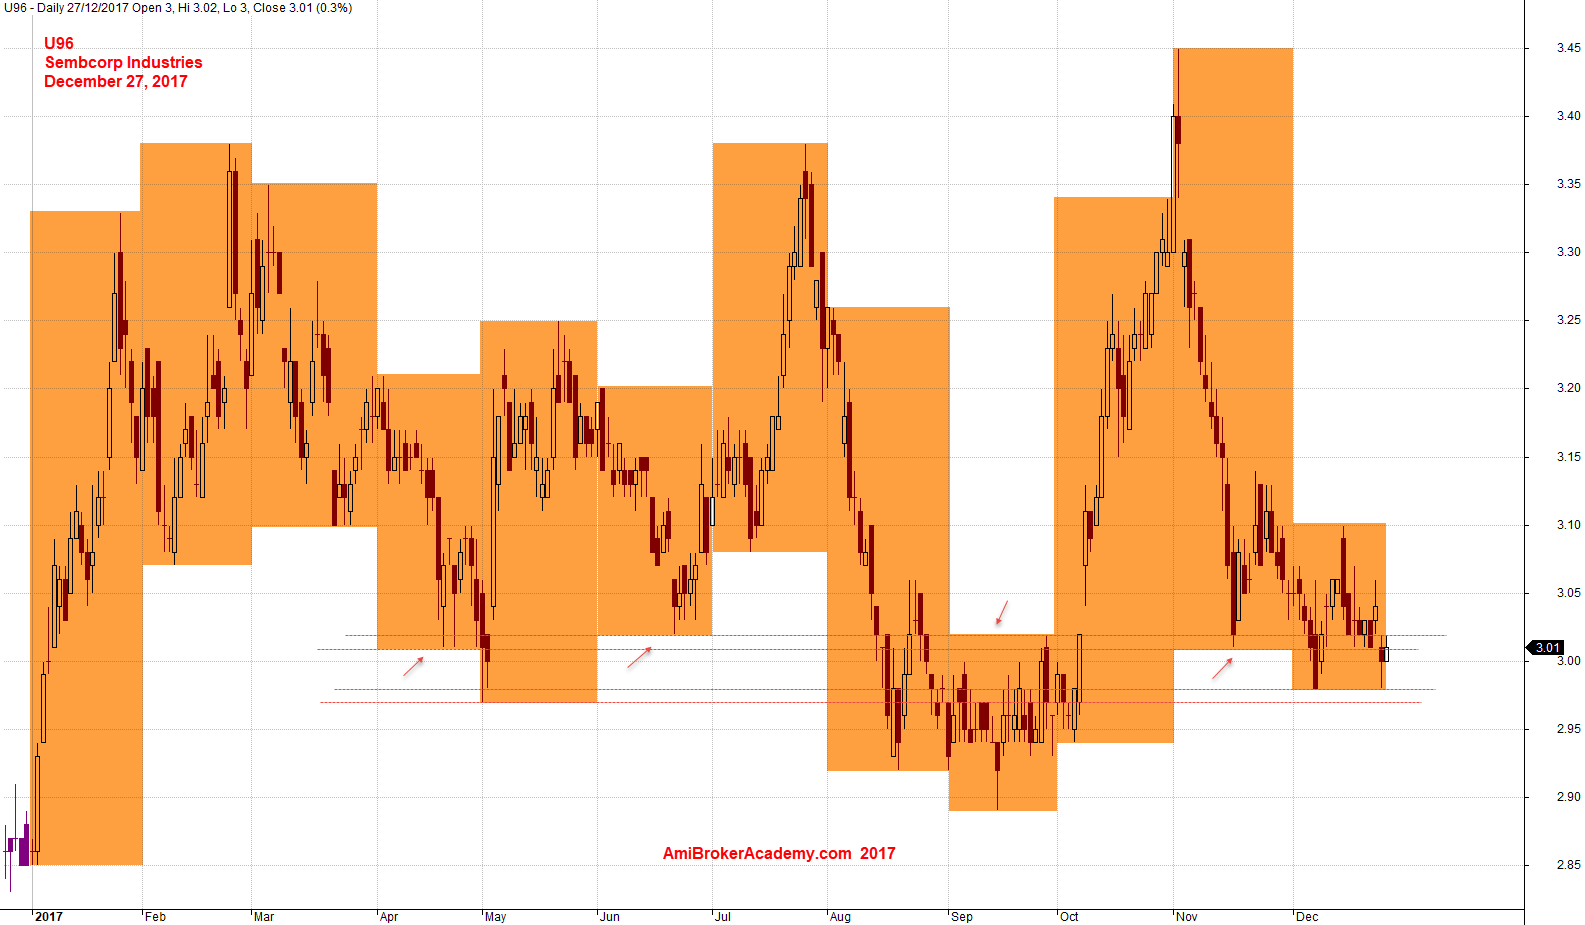
December 27, 2017 Sembcorp Industrial and Month High Low
U96 Sembcorp Industries and MACD Indicator
MACD histogram moves sideways, but the stock price moves higher. So what?
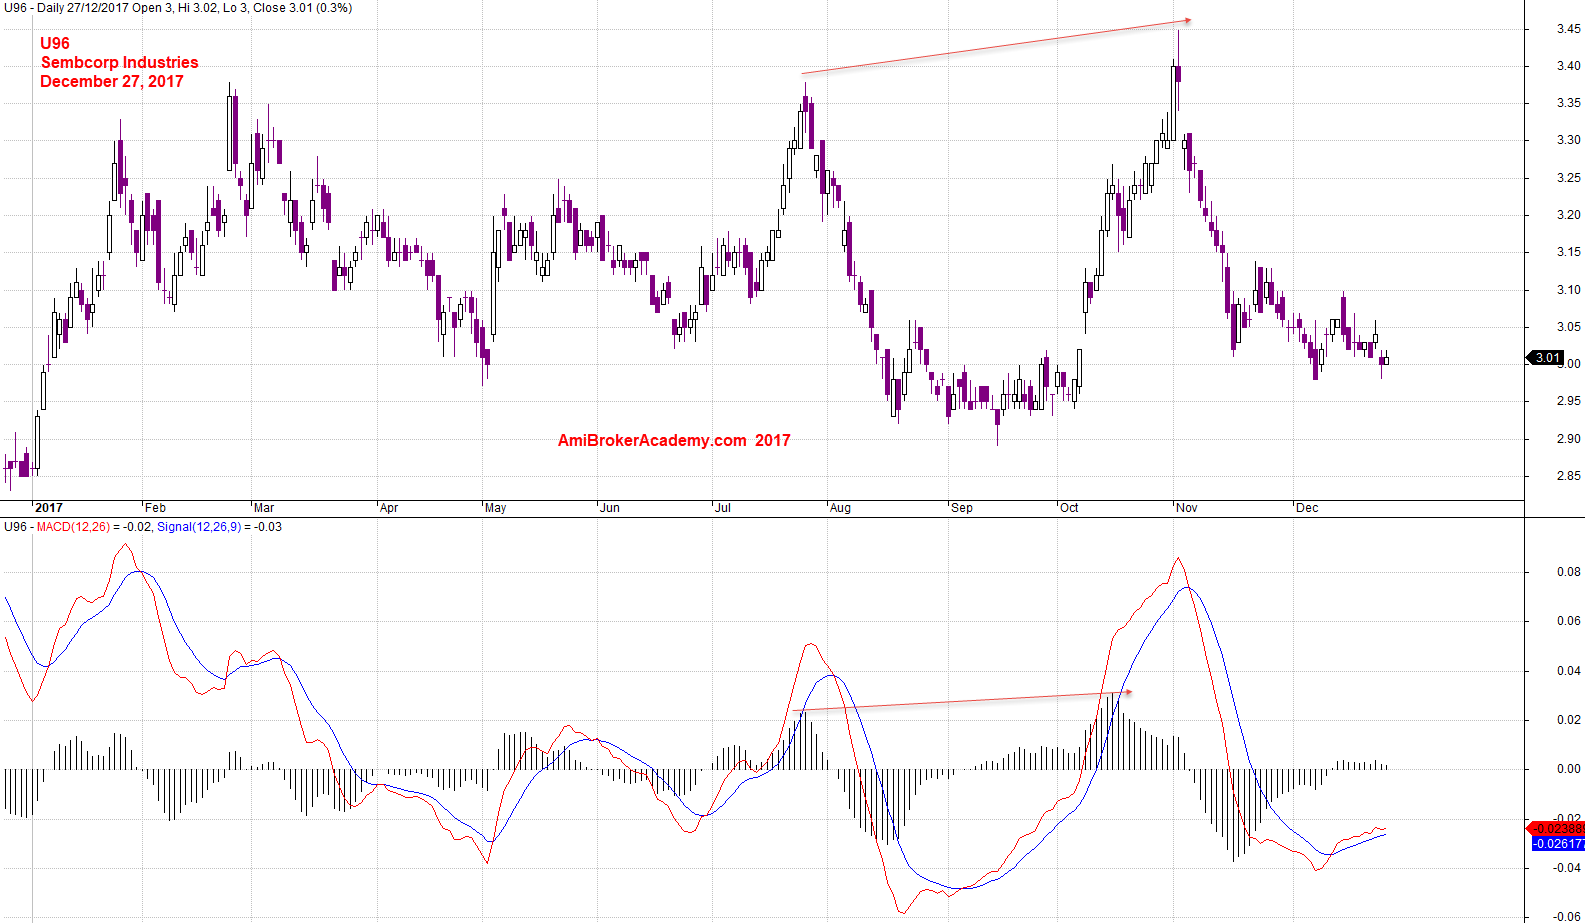
December 27, 2017 Sembcorp Industrial and MACD
U96 Sembcorp Industries and 34 MA Band
See chart for more.
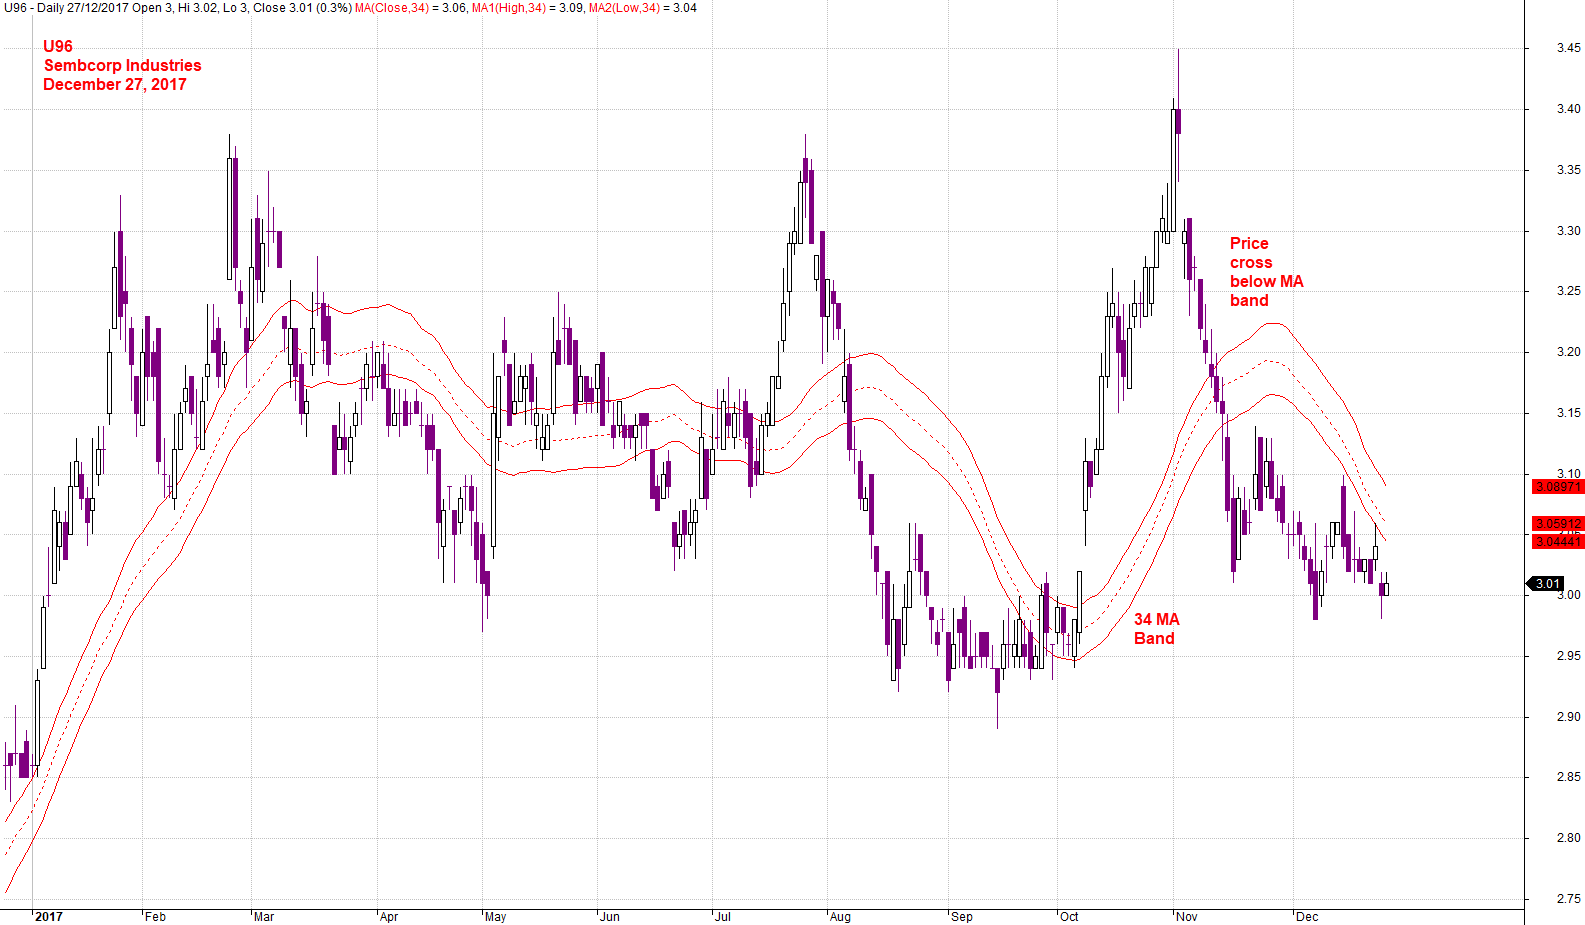
December 27, 2017 Sembcorp Industrial and 34 MA Band
Moses
AmiBrokerAcademy.com
Disclaimer
The above result is for illustration purpose. It is not meant to be used for buy or sell decision. We do not recommend any particular stocks. If particular stocks of such are mentioned, they are meant as demonstration of Amibroker as a powerful charting software and MACD. Amibroker can program to scan the stocks for buy and sell signals.
These are script generated signals. Not all scan results are shown here. The MACD signal should use with price action. Users must understand what MACD and price action are all about before using them. If necessary you should attend a course to learn more on Technical Analysis (TA) and Moving Average Convergence Divergence, MACD.
Once again, the website does not guarantee any results or investment return based on the information and instruction you have read here. It should be used as learning aids only and if you decide to trade real money, all trading decision should be your own.