February 23, 2018
You can expect to have a very special situation this year, just at the start of 2018. US stock markets leading the world into a market correction. Have you ever think why now and not six months ago? At least for Fibonacci retracement when you do and swing low to high, you can see great retracement back down to 61.8% or 78.6%. Otherwise, many has wonder will Fibonacci works for stock markets.
Eighth Day CNY
Everyday in the fifteen day of CNY all has it unique meaning. This is the eighth day of Chinese New Year. Be happy.

Eighth Day Chinese New Year (Source: What’s Apps Group)
Powerful Chart Software – AmiBroker
The following chart is produced using AmiBroker charting software. It is a powerful chart software. You plot the stocks you are interested all in one chart, as long as you still could read them. See chart below. Thereafter slowly climb up, step by step.
U11 United Overseas Bank and Fibonacci Retracement
See chart for more, picture worth a thousand words the price action swing low from the September low to January high. Price action is making a near 50% retracement. Be careful of setting your hopes too high, though. Reference to the MA band for more. The price action may get resisted by the MA Band.
Manage your risk.
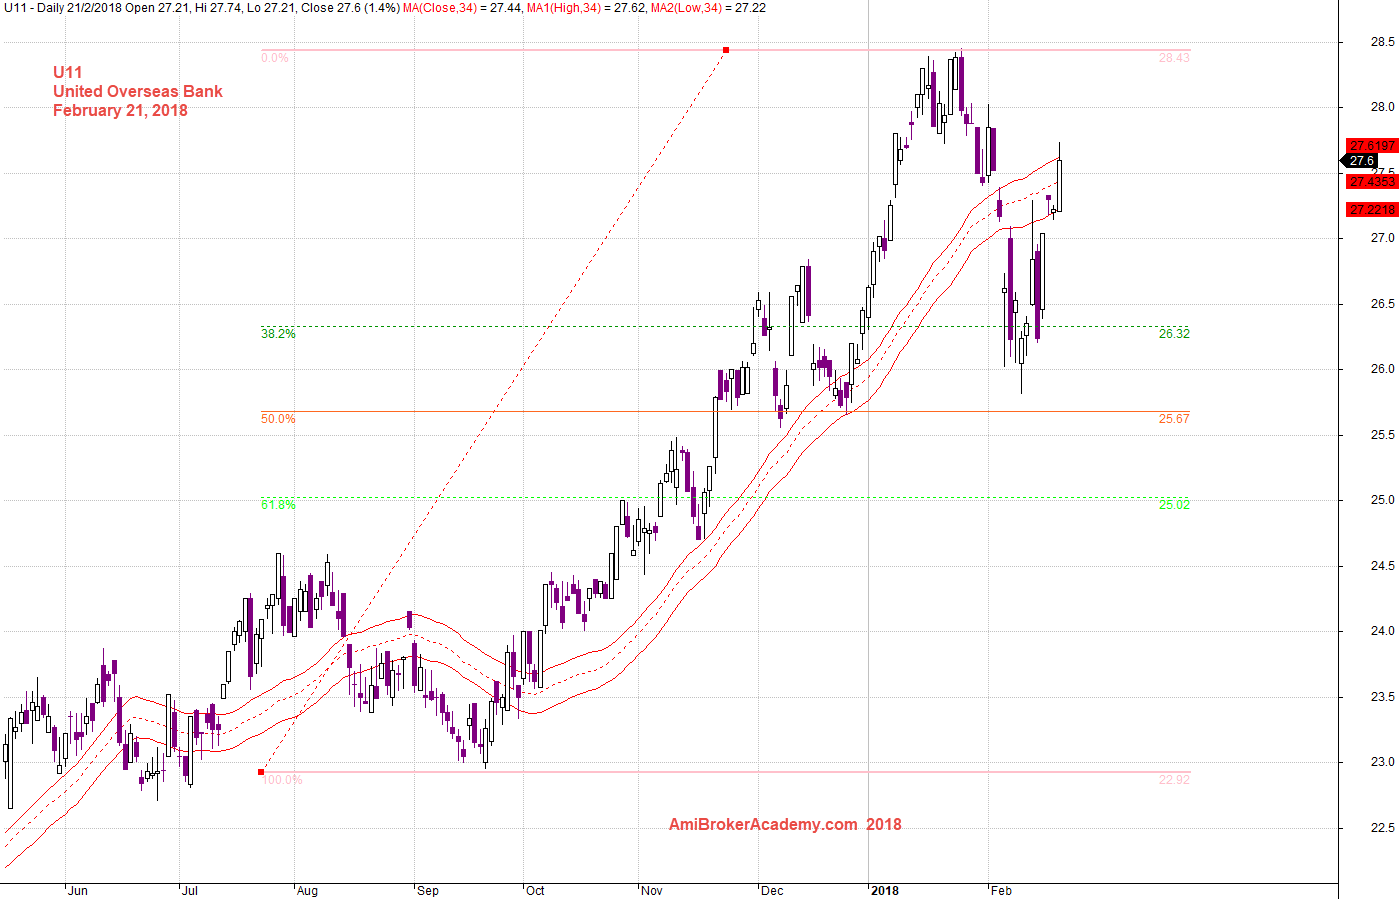
20180221 United Overseas Bank and MA Band and Fibonacci Retracement
U11 United Overseas Bank and Fibonacci Retracement
Let’s study the chart using from another angle, swing high to low, and you see a retracement after the decline. The retracement close above 61.8%. Will the trend continue. Will see.
Manage your risk.
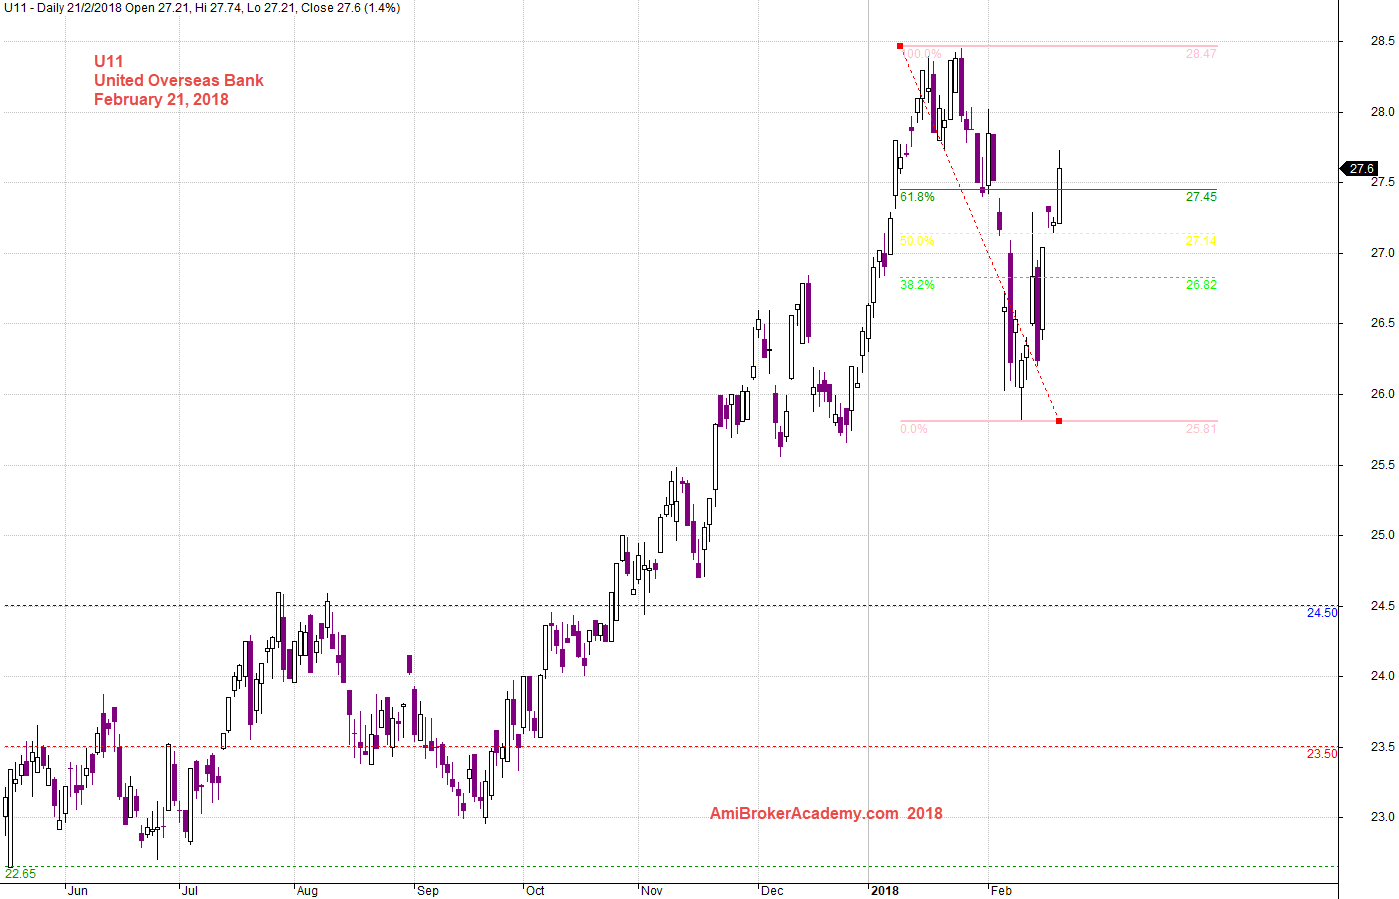
20180221 United Overseas Bank and Fibo Retracement Swing High to Low
Moses
AmiBrokerAcademy.com
Disclaimer
The above result is for illustration purpose. It is not meant to be used for buy or sell decision. We do not recommend any particular stocks. If particular stocks of such are mentioned, they are meant as demonstration of Amibroker as a powerful charting software and MACD. Amibroker can program to scan the stocks for buy and sell signals.
These are script generated signals. Not all scan results are shown here. The MACD signal should use with price action. Users must understand what MACD and price action are all about before using them. If necessary you should attend a course to learn more on Technical Analysis (TA) and Moving Average Convergence Divergence, MACD.
Once again, the website does not guarantee any results or investment return based on the information and instruction you have read here. It should be used as learning aids only and if you decide to trade real money, all trading decision should be your own.