November 27, 2017
^TYX 30-Year Treasury Yield and Its Trends
See the last sixteen months of 30-Year Treasury Yield. First it went rally, followed sideways, then started to decline.
In trading, it is not what you (those masters and gurus) think, but it is how you think. Remember to trade what you see, if you are in the market, you probably notice that the indexes again making record high and higher again. But from the 10-Year T-Note and this bond, the trend begin to decline.
…
The following chart is plot by AmiBroker charting software. AmiBroker is a powerful charting software.
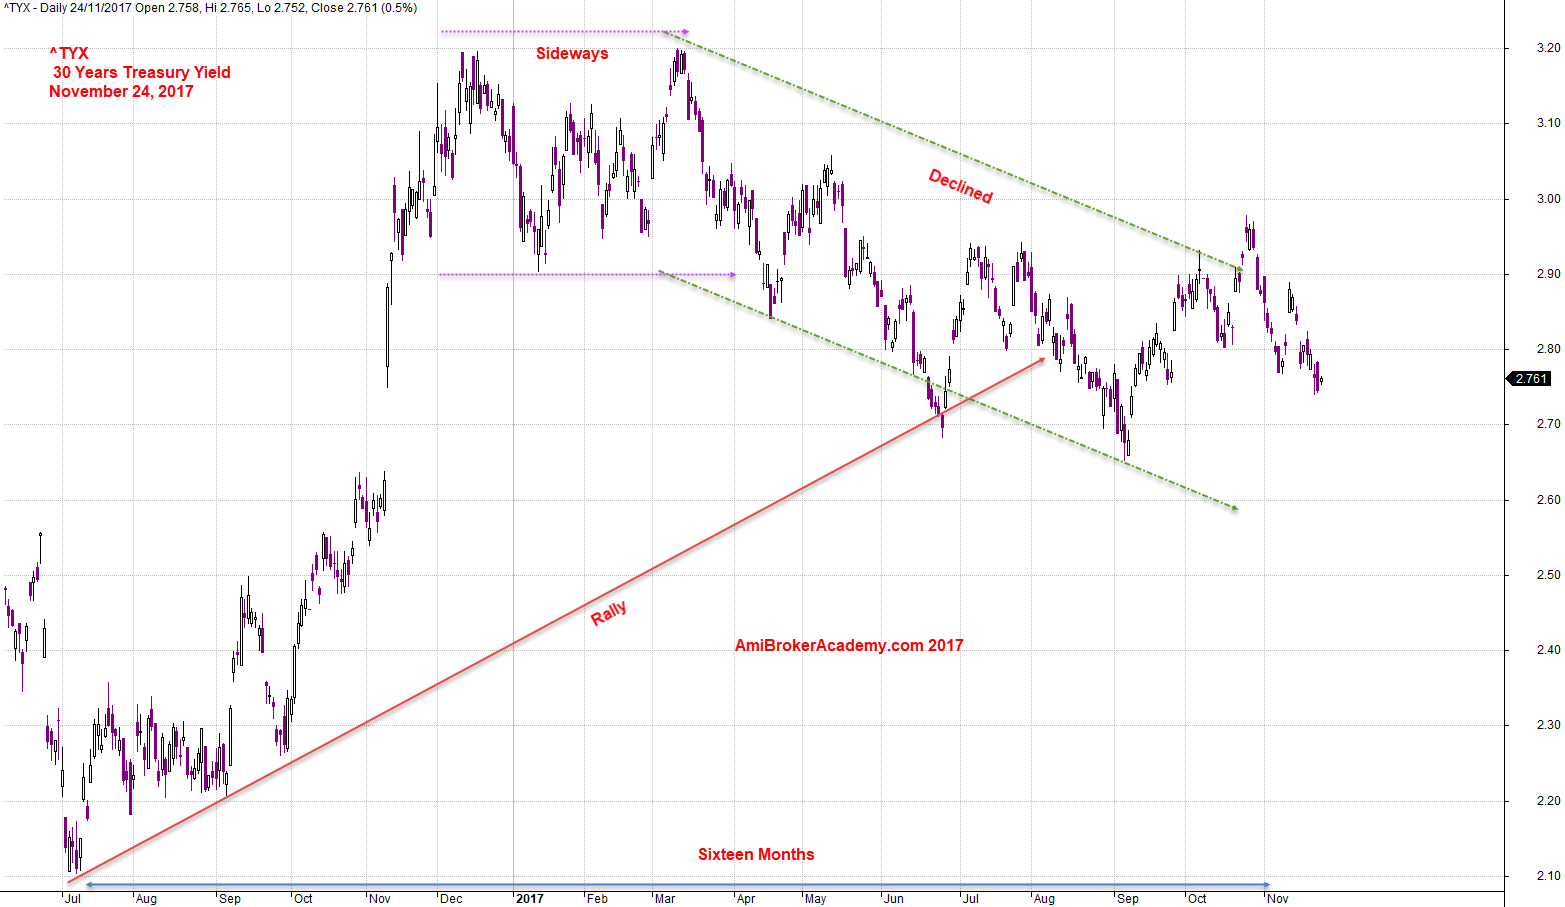
November 24, 2017 30-Year Treasury Yield and Trends
Junk Bond
In financial, Junk Bond refers to a high-yield or a noninvestment-grade bonds. For Junk Bonds are fixed-income instruments that carry a credit rating of BB or lower by organization such as Standard & Poor’s, or Moody’s Investors Service. Junk bonds carry a higher default risk compare to investment-grade bonds.
Bond Rating
Most bonds carry a rating from one of the three independent finance rating agencies, namely Standard & Poor’s, Moody’s, and Fitch. These agencies conduct a thorough financial analysis of the entity that is issuing the bond.
They base upon their own rating criteria. These agency’s use their set criteria, analysts determine the entity’s ability to pay their bills and remain liquid and assign a credit rating to the bond.
Warren Buffett’s Rules in Investment
You know, this is what I was told Warren Buffett’s two rules of investing.
Rule number one don’t lose money. Rule number two don’t violate rule number one.
But, I have to say I do not know him, as I have never met him before. My understanding is to have launch with him I have to pay a lot of money. …

Source: Photo from Internet. Photo by Paul Morigi/Getty Images for Fortune/Time Inc)
Warren Buffett
Moses
AmiBrokerAcademy.com
Disclaimer
The above result is for illustration purpose. It is not meant to be used for buy or sell decision. We do not recommend any particular stocks. If particular stocks of such are mentioned, they are meant as demonstration of Amibroker as a powerful charting software and MACD. Amibroker can program to scan the stocks for buy and sell signals.
These are script generated signals. Not all scan results are shown here. The MACD signal should use with price action. Users must understand what MACD and price action are all about before using them. If necessary you should attend a course to learn more on Technical Analysis (TA) and Moving Average Convergence Divergence, MACD.
Once again, the website does not guarantee any results or investment return based on the information and instruction you have read here. It should be used as learning aids only and if you decide to trade real money, all trading decision should be your own.