November 21, 2017
Trading Never Be Easy
Some years ago, when I told a friend I am trading now. She told me at that time, trading, trading is an easy task. Just buy low and sell high.
If this is true, there will be many successful traders. Unfortunately, there is always a saying, 99% of the traders lost their pant. See the chart below and judge for yourself.
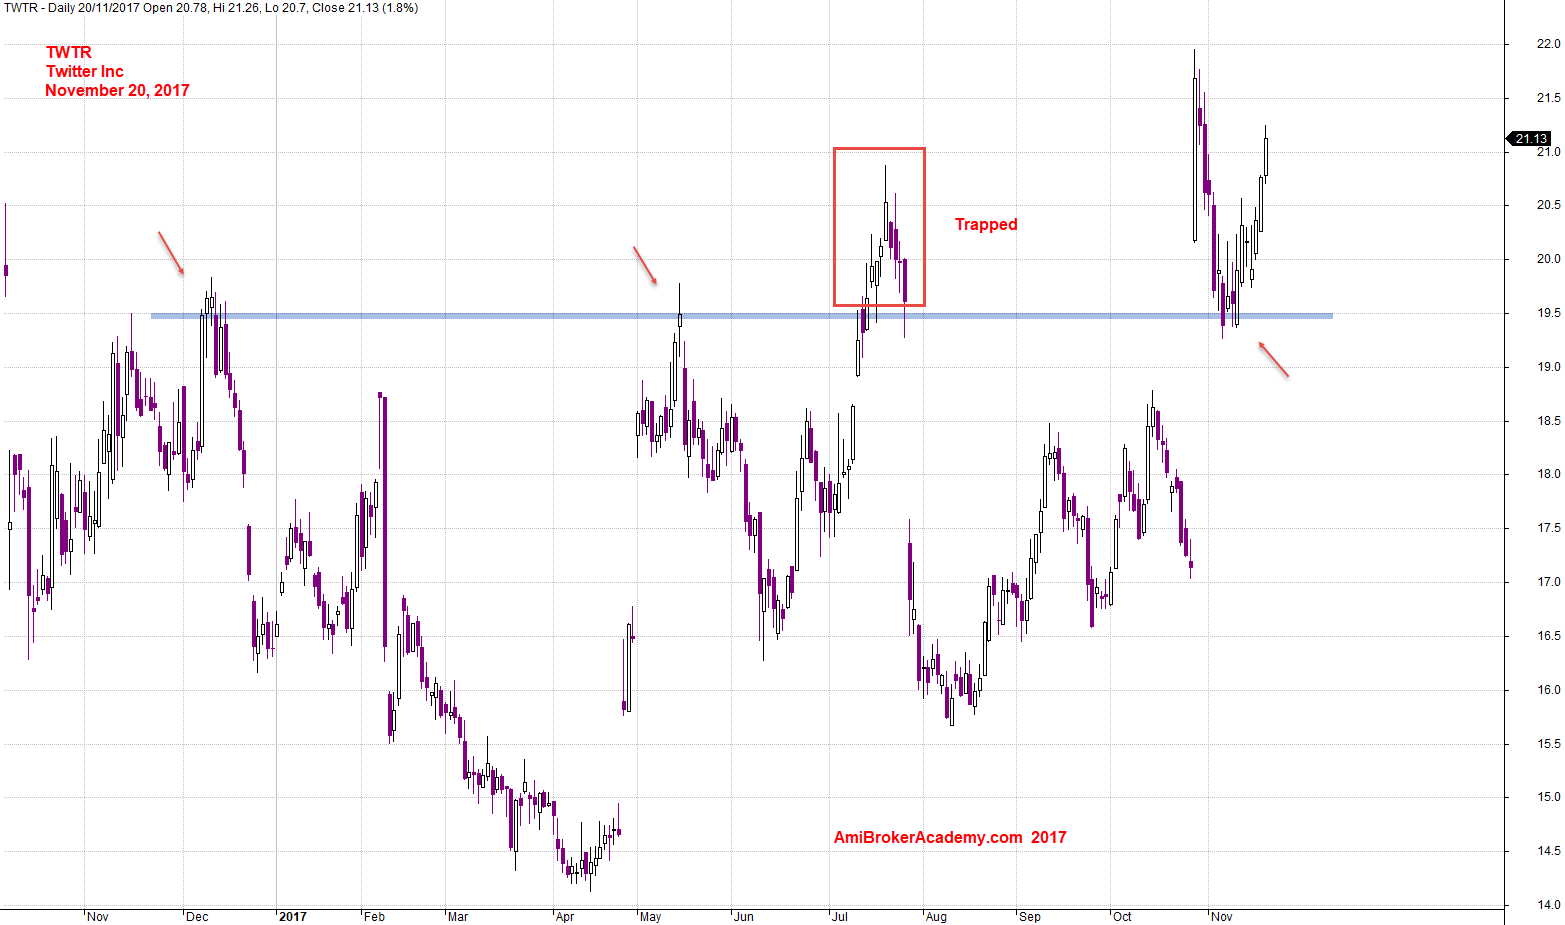
TWTR Twitter Inc and Support Resistance
Twitter tested 21 dollars and fail, the price fall and hold at 16 dollars. Since than the price keeps moving higher and higher. Remember, price does not move in straight line; price action travel in zigzag. Price action always look for good level to take a break; all the past support and resistance are good candidate for price action to change direction.
19.5 dollars is a strong level, resistance, resistance again, … now resistance turns support. See chart for more.
The following chart is plot by AmiBroker charting software. AmiBroker is a powerful charting software.
November 20, 2017 Twitter Inc and Support Resistance
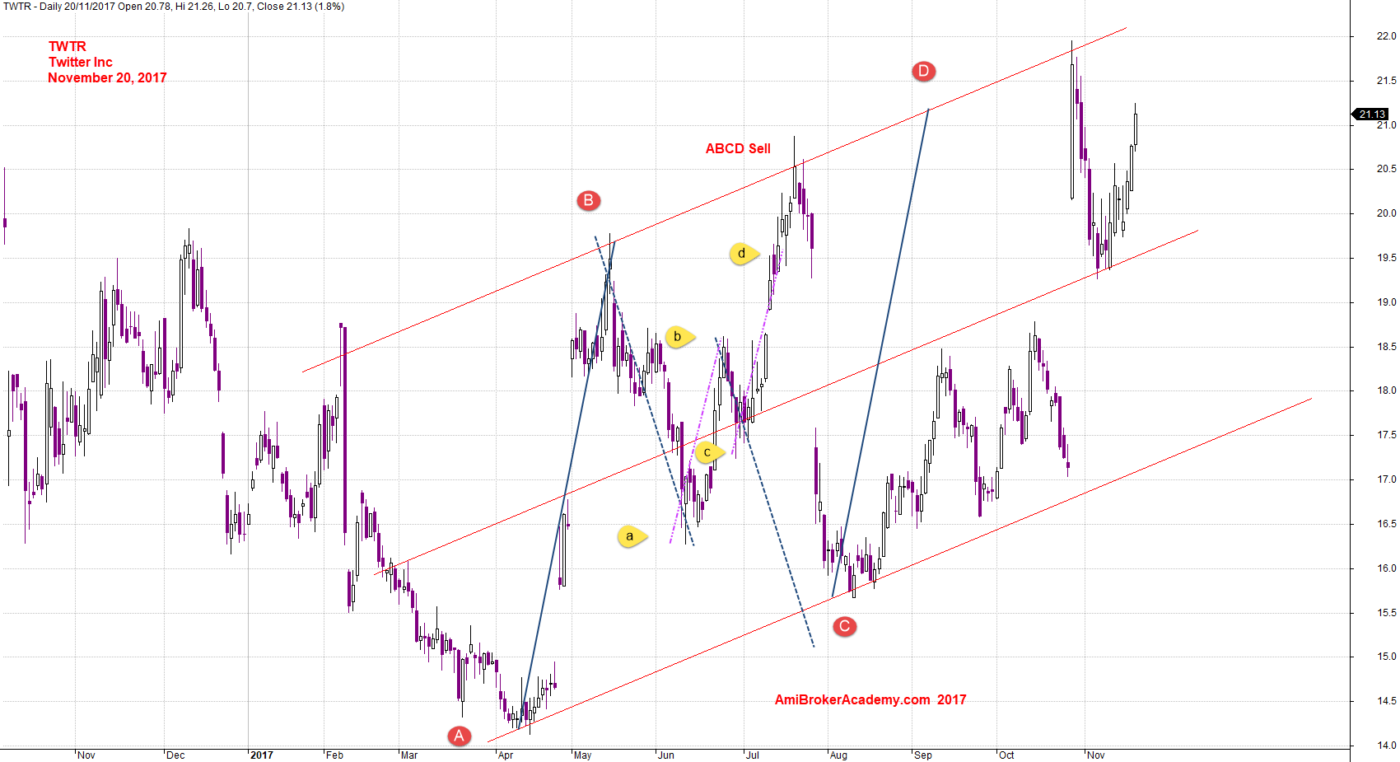
Twitter Inc and Channel and ABCD Pattern
Trading is just like travel, you must have a plan. Either you plan the trip yourself or have someone to plan for you. Same same for trading, some traders rely on Guru or Master for the trade plan, and other traders are rely on their own skill to plan for their trade.
See chart, if you have trade plan reference the channel to guide you, and adding the ABCD pattern suggestion, you could guest the trade could be continue to be bullish, and try to look for opportunity to buy up. Of course, all setup can fail. The risk of success or fail are always 50 50, as if the price does not go up, the price will come down, but such as support resistance, bullish signals, ABCD pattern will change the 50 50 risk to 40 60 or ….
So, trading is not like many people think, it is an easy game. Trading is no different of running a business, a company. If running business or company is easy, then they will always be around. Check, how many big and historical company have disappear from the world. Check around.
The following chart is plot by AmiBroker charting software.
November 20, 2017 Twitter Inc and Channel
HM Gartley ABCD Pattern, Support Resistance, Channel and Moving Average are great tool to reference for trade. Have fun!
Think Think
Think think got more thing, just in case, we are not AmiBroker, we are just AmiBroker’s fan and enthusiast. Contact them for more. Kudos to Tomasz Janeczko, the founder of AmiBroker.
Moses
AmiBrokerAcademy.com
Disclaimer
The above result is for illustration purpose. It is not meant to be used for buy or sell decision. We do not recommend any particular stocks. If particular stocks of such are mentioned, they are meant as demonstration of Amibroker as a powerful charting software and MACD. Amibroker can program to scan the stocks for buy and sell signals.
These are script generated signals. Not all scan results are shown here. The MACD signal should use with price action. Users must understand what MACD and price action are all about before using them. If necessary you should attend a course to learn more on Technical Analysis (TA) and Moving Average Convergence Divergence, MACD.
Once again, the website does not guarantee any results or investment return based on the information and instruction you have read here. It should be used as learning aids only and if you decide to trade real money, all trading decision should be your own.