January 21, 2017
Welcome to Moses’s Stock Analysis at AmiBrokerAcademy.com.
If you have been following the site here, you will probably notice that the recent post we emphasize a lot on the MACD indicator. In fact, MACD is a leading indicator, it signal a possible change in trend direction. It gives the trader a lot of room to think and plan their trade. But note, we are very dynamic we do not keep to only one way to analyse the chart. Have fun!
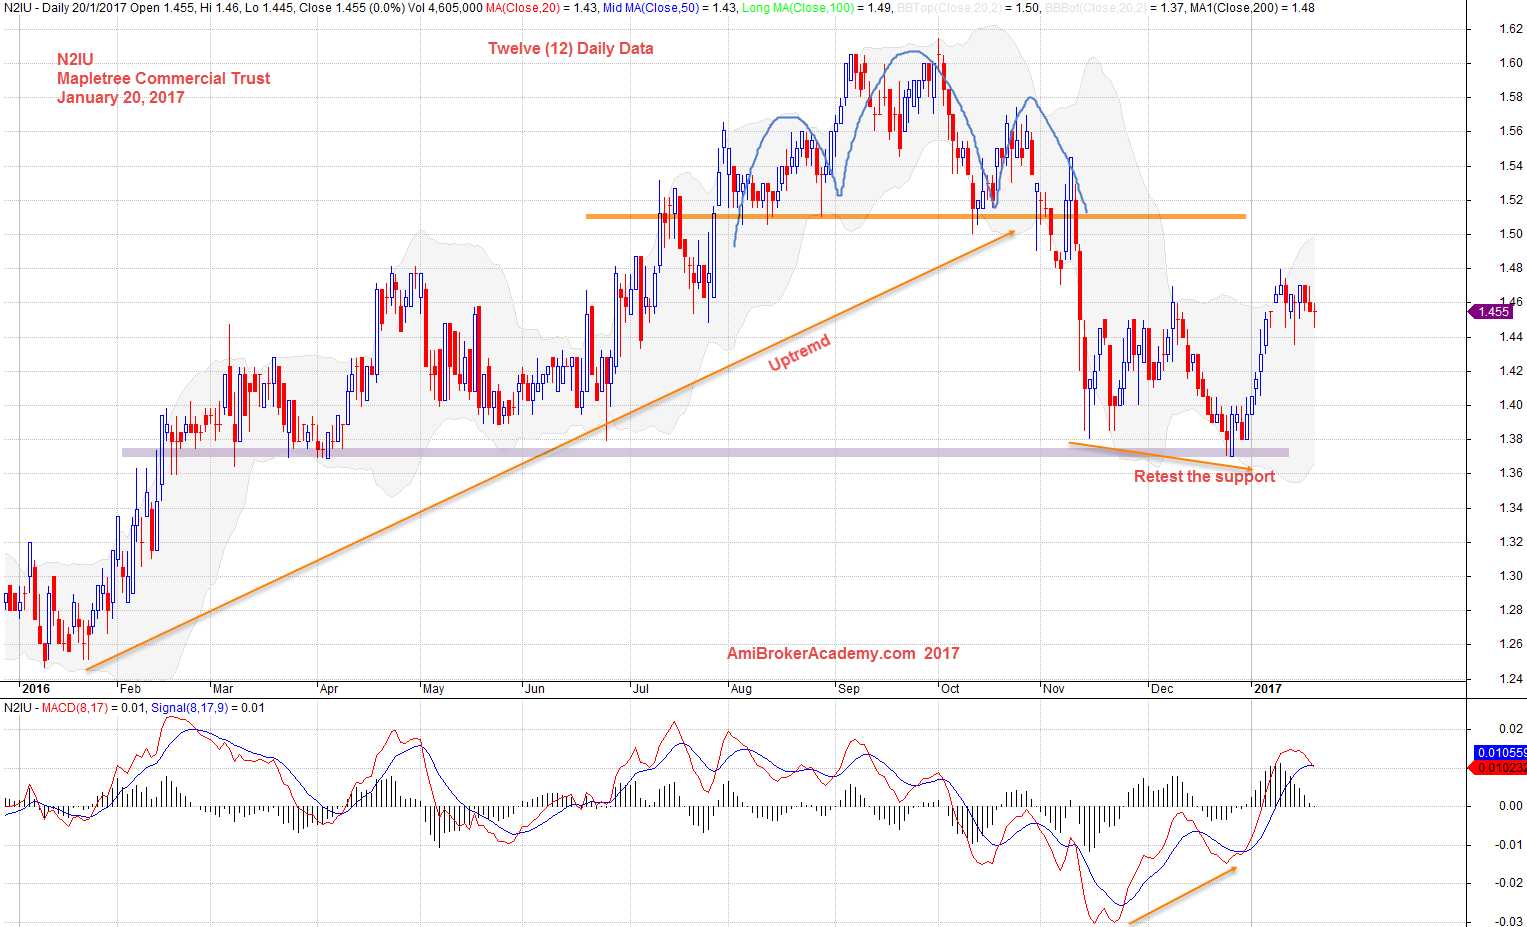
Twelve (12) Months Mapletree Commerciasl Trust Daily
2016 is a very interesting year for Mapletree, we see trust price goes from the low from the bottom left to the high toward the end of the third quarter of 2016, and suddenly the price take a big fall. The price get supported again at the last support. If you have turn on your MACD indicator, you probably will be very caution in holding the stock. As the MACD goes below the zeroline. Needless to say, for those experience traders. They will probably reduce their holding for the worst case to come. This is what we said, trade what you see and not what you think.
2017, the trust begin from a new level. Can the trust like 2016, move higher before reverse to find a support. Will see.
at the center of the chart and goes down again low to the bottom right. The interesting sight is the stock moves from low to high to higher low to higher high. Then the the stock takes a reversal and bring the stock price back to the square one again.
Clue, check the MACD signal. We see MACD signal, MACD touch the signal line, at the start of cross down signal. But, all setup can fail, the cross down can be rejected. Yes, it signals the price may go lower. Again, remember trade what you see and not what you think.
January 20, 2017 Mapletree Commercial Trust Twelve Months Data Chart
Closeup View of Mapletree Commercial Trust Daily
Can the breakout continue?
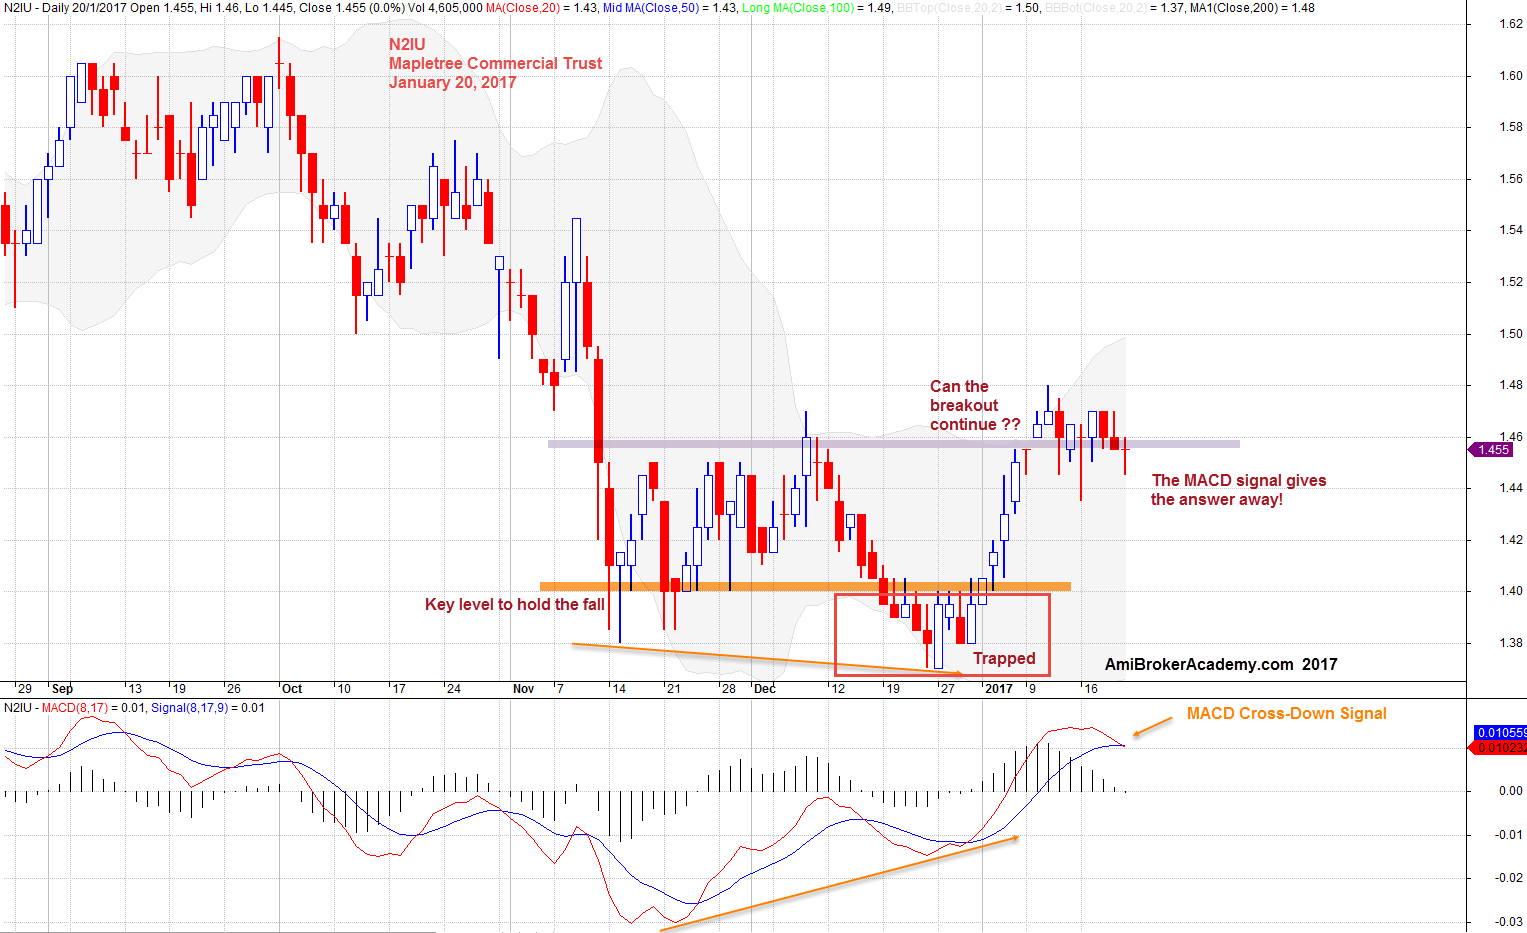
January 20, 2017 Mapletree Commercial Trust Close up View
Moses
AmiBrokerAcademy.com
Disclaimer
The above result is for illustration purpose. It is not meant to be used for buy or sell decision. We do not recommend any particular stocks. If particular stocks of such are mentioned, they are meant as demonstration of Amibroker as a powerful charting software and MACD. Amibroker can program to scan the stocks for buy and sell signals.
These are script generated signals. Not all scan results are shown here. The MACD signal should use with price action. Users must understand what MACD and price action are all about before using them. If necessary you should attend a course to learn more on Technical Analysis (TA) and Moving Average Convergence Divergence, MACD.
Once again, the website does not guarantee any results or investment return based on the information and instruction you have read here. It should be used as learning aids only and if you decide to trade real money, all trading decision should be your own.