July 19, 2017
World number one, semiconductor outsource manufacturing TSMC.
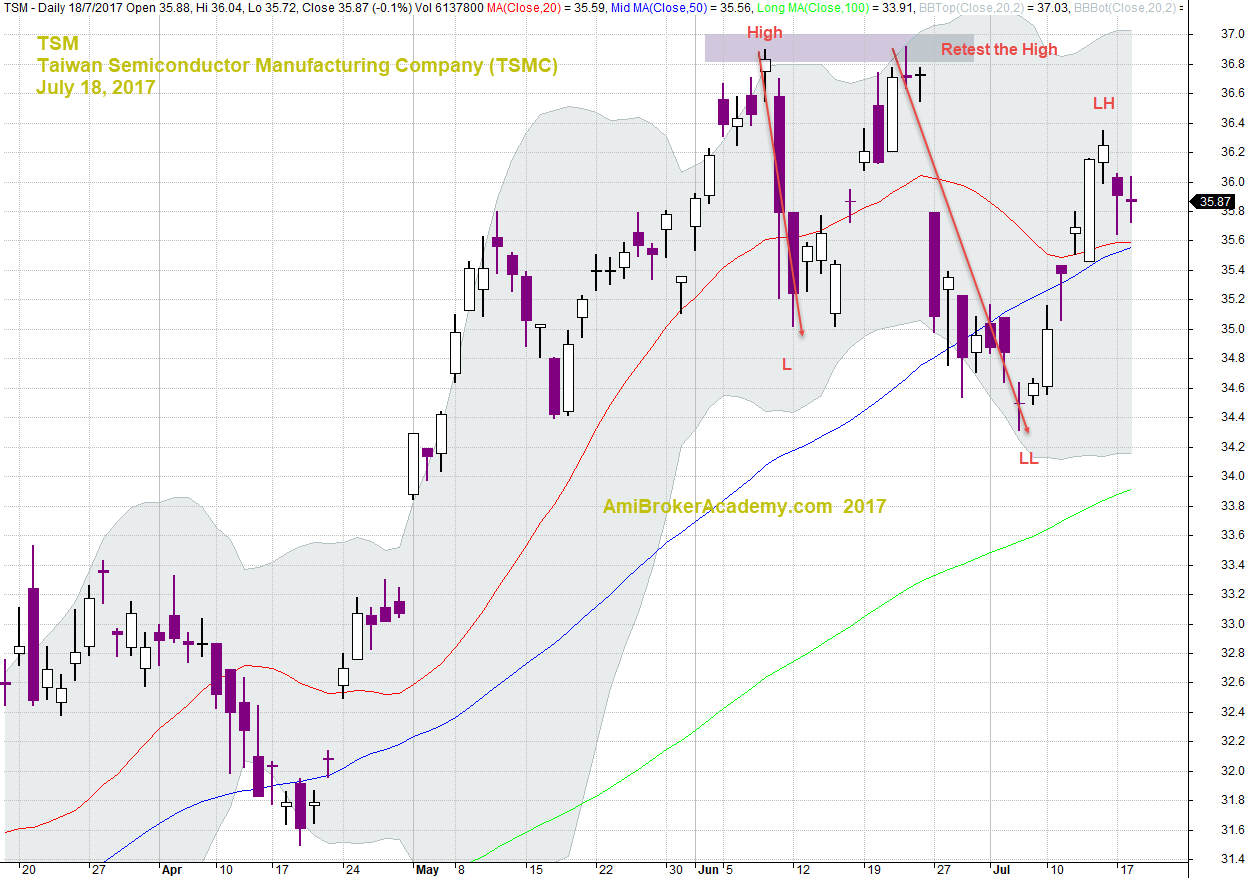
TSM aka TSMC and Retest High
See chart for more, picture worth a thousand words.
Share price upflow, retest high, topping, and downflow. The price is forming lower low and lower high.
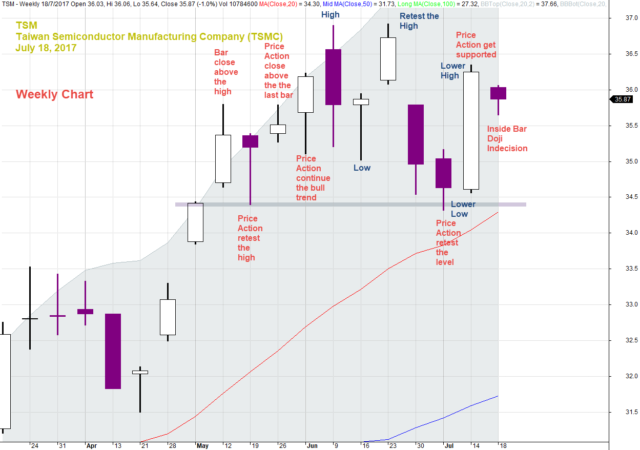
July 18, 2017 TSMC and High Low
TSMC Weekly Chart
What can you derive from the weekly chart? See chart for more.
July 18, 2017 TSMC Weekly and High Low
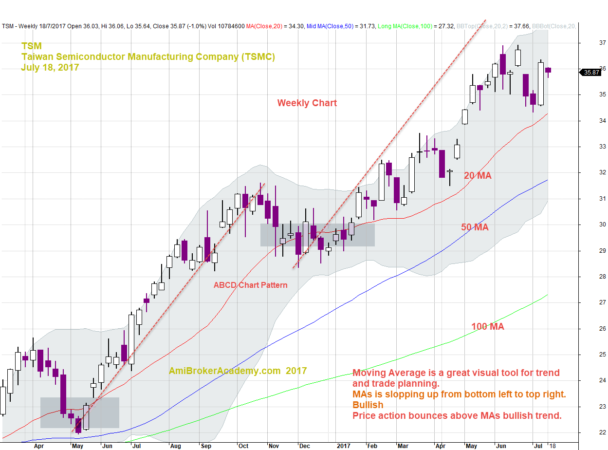
TSM Taiwan Semiconductor Manufacturing Company Weekly and ABCD Chart Pattern
Have fun! See ABCD Chart Pattern? No problem right.
July 18, 2017 TSMC Weekly and ABCD Chart Pattern
TSM Taiwan Semiconductor Manufacturing Company and MACD
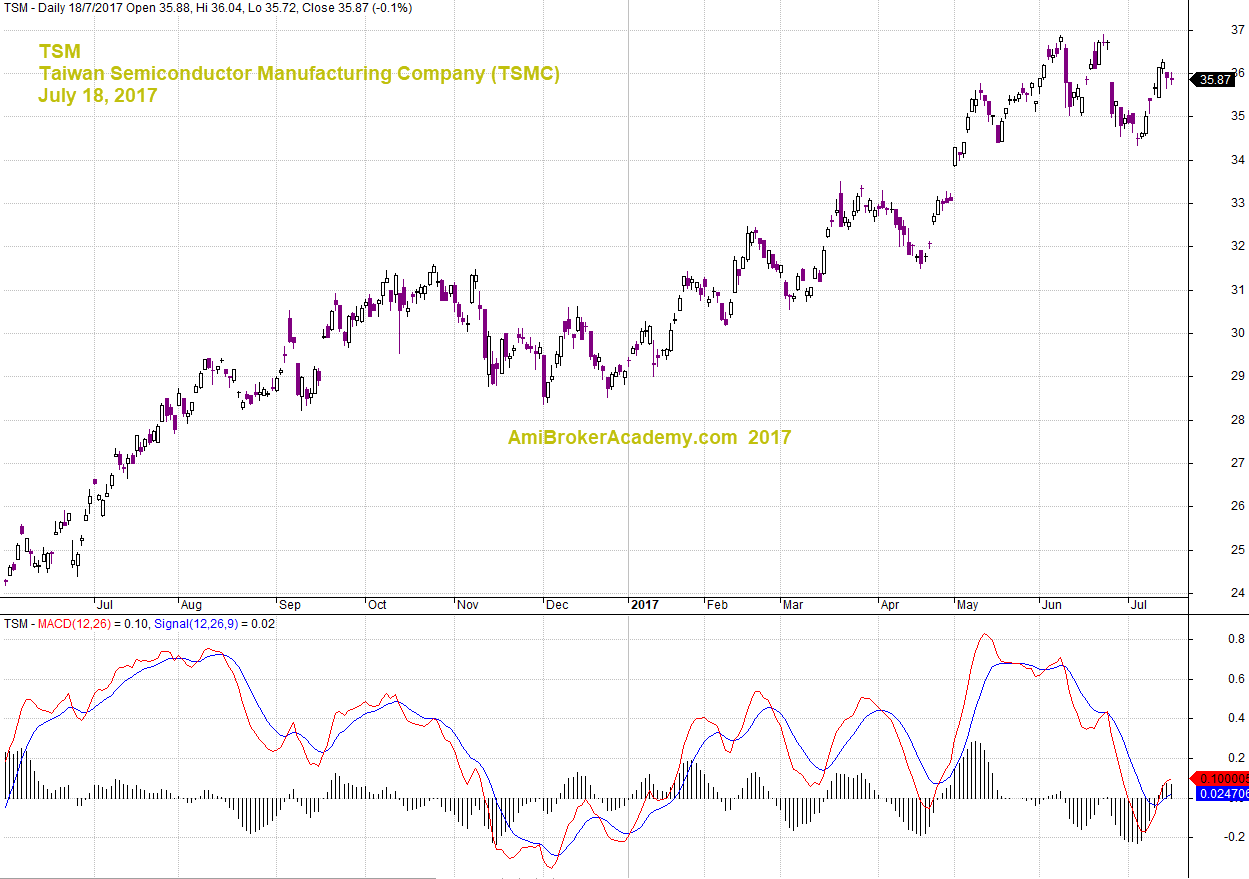
July 18, 2017 TSMC and MACD Signals
TSM Taiwan Semiconductor Manufacturing Company and Channel
Channel is a good tool to see trend. Channel slopping from bottom left to top right, slopping up. Uptrend.
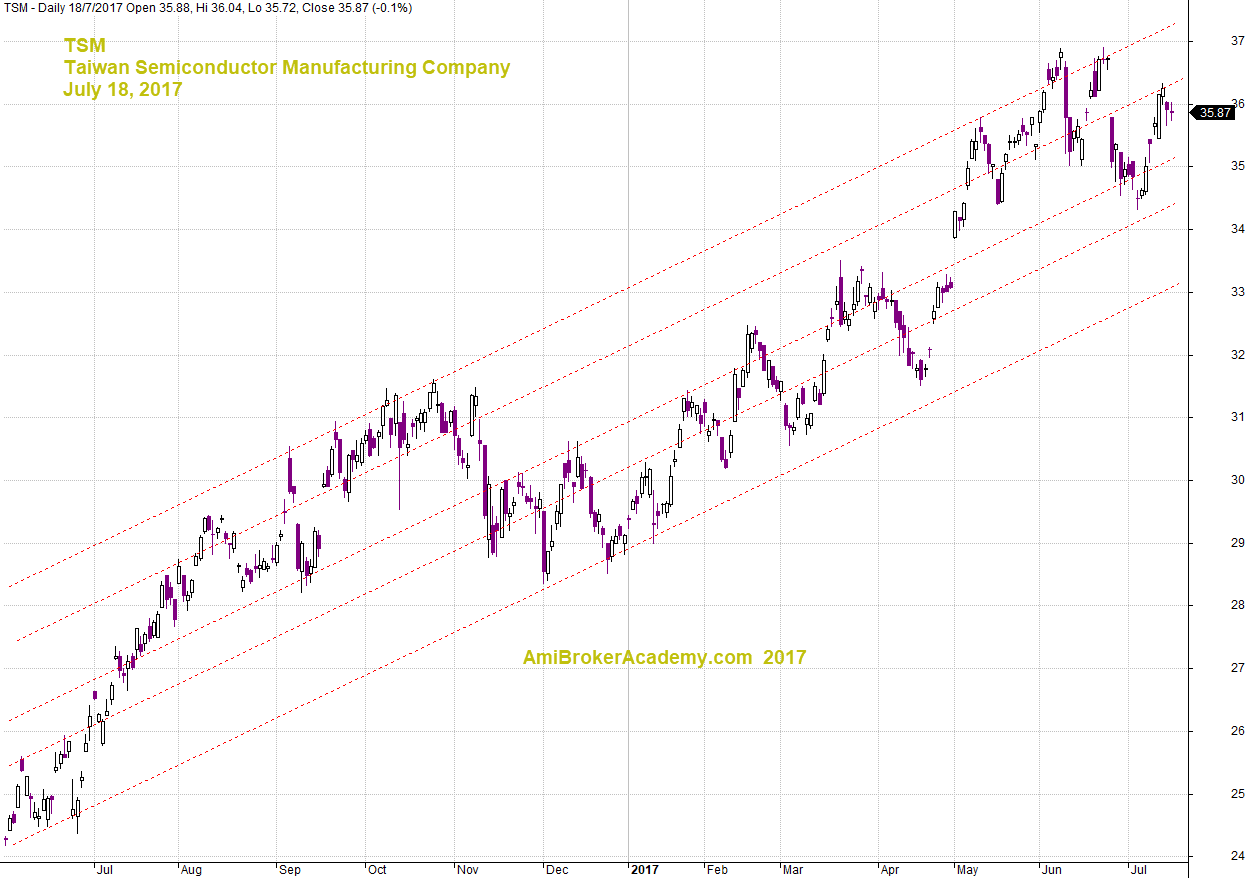
July 18, 2017 TSMC and Channel
Thanks for visit the site here. You could also find free MACD scan here in this site too.
Moses
AmiBrokerAcademy.com
Disclaimer
The above result is for illustration purpose. It is not meant to be used for buy or sell decision. We do not recommend any particular stocks. If particular stocks of such are mentioned, they are meant as demonstration of Amibroker as a powerful charting software and MACD. Amibroker can program to scan the stocks for buy and sell signals.
These are script generated signals. Not all scan results are shown here. The MACD signal should use with price action. Users must understand what MACD and price action are all about before using them. If necessary you should attend a course to learn more on Technical Analysis (TA) and Moving Average Convergence Divergence, MACD.
Once again, the website does not guarantee any results or investment return based on the information and instruction you have read here. It should be used as learning aids only and if you decide to trade real money, all trading decision should be your own.