25 September 2016
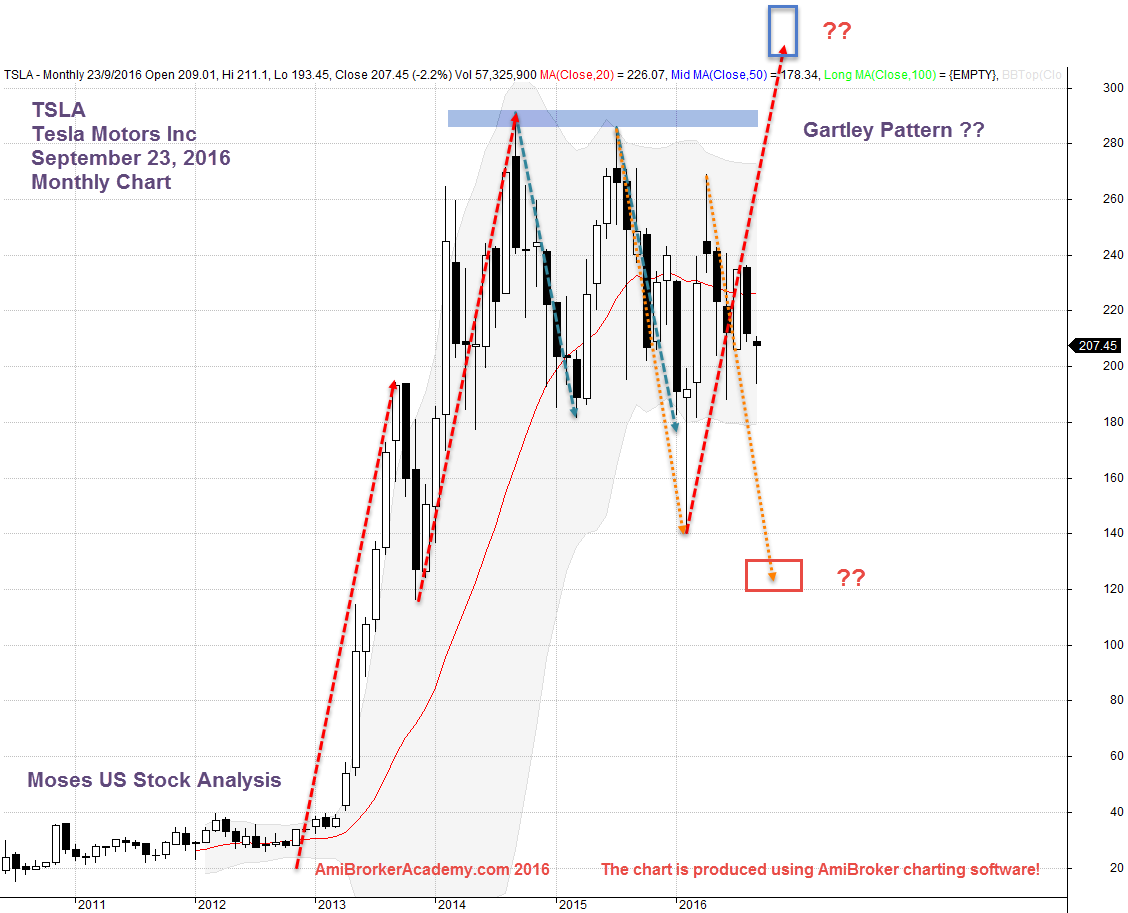
Tesla Motors is in the public limelight. Let see the stock in a big picture. How was the stock performed for the last few years. You can easily find out the company start to catch the attention of the investors. The stock start to travel north since then. If you have the far sight, ha ha you properly laughing to the bank at its peak.
It is easy say than done. In a aftermath, the results is always very rosy. See the monthly chart for more.
TSLA Tesla Motors Inc Monthly Chart
See any familiar Gartley Pattern. You can see many ABCD chart pattern. So, what’s next? Will see. When you got the direction right, just sit back and let the auto pilot kick in. Is it as easy as ABC? No, no, no one can read the market. Manage your Risk the take your profit step by step. There is no long a bull or bear market like the past. With all the rate hike keep coming back to hound you.
Be aware!

September 23, 2016 Tesla Motors Inc Monthly Chart
Have fun!
Moses US Stock Analysis
AmiBrokerAcademy.com
Disclaimer: All information, data and material contained, presented, or provided on amibrokeracademy.com is for educational purposes only. It is not to be construed or intended as providing trading or legal advice. Decisions you make about your trading or investment are important to you and your family, therefore should be made in consultation with a competent financial advisor or professional. We are not financial advisor and do not claim to be. Any views expressed here-in are not necessarily those held by amibrokeracademy.com. You are responsible for your trade decision and wealth being.
