September 11, 2017
TSLA Tesla Motors and Support Resistance
Picture worth a thousand words. Forget about $380, $360 is a level to watch. Can the share price breakout higher than $360. Will see.
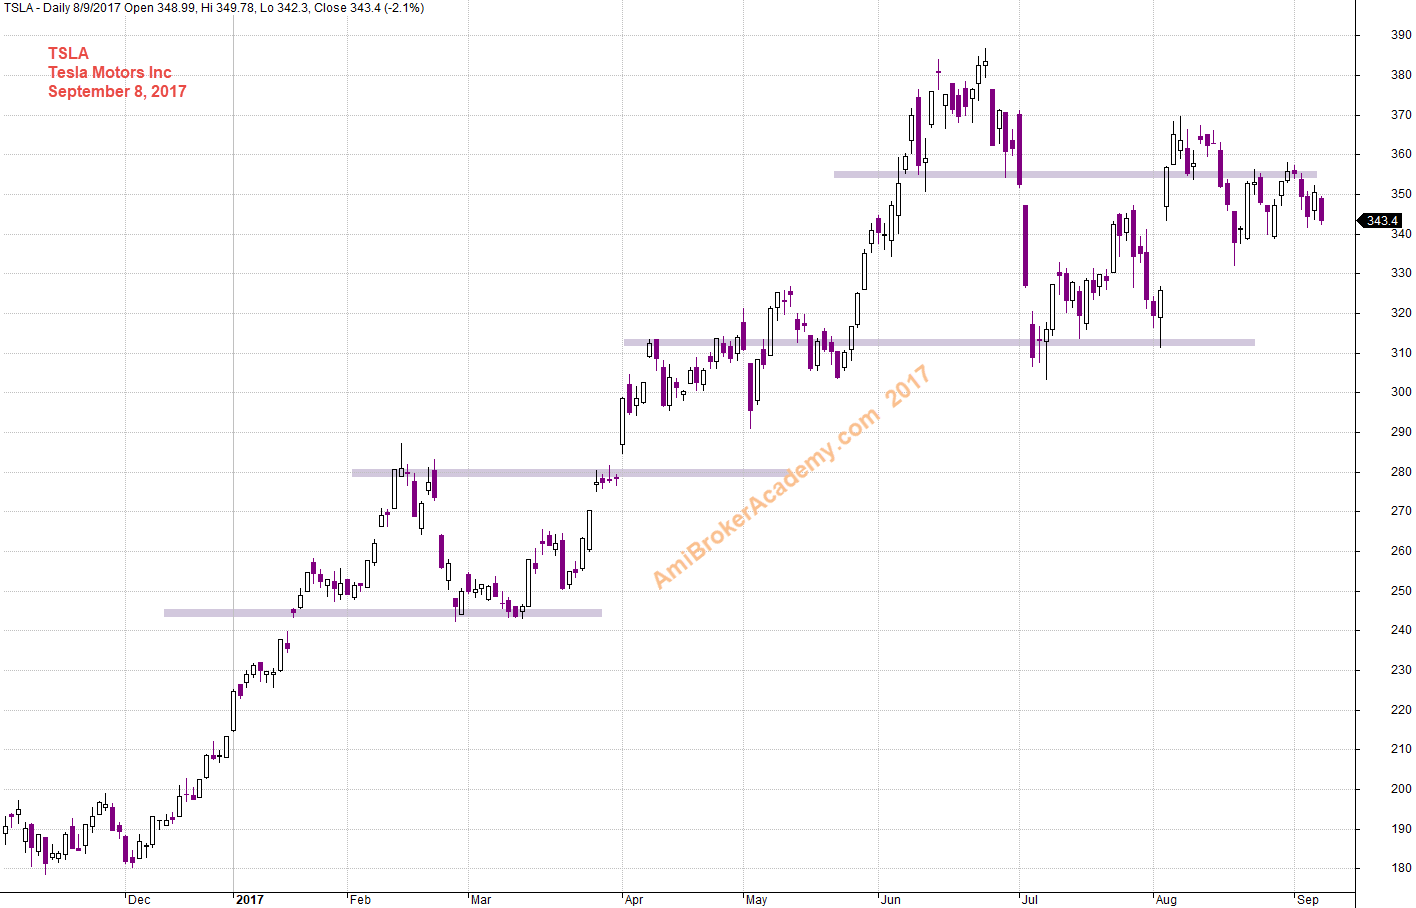
September 8, 2017 Tesla Motors and Support Resistance
Tesla Motors Inc and Wave Count
Picture worth a thousand words, see chart for more. Remember no two Elliott Wave Engineer see the same wave count. If the count is correct, there is still a lot of zigzag to go.
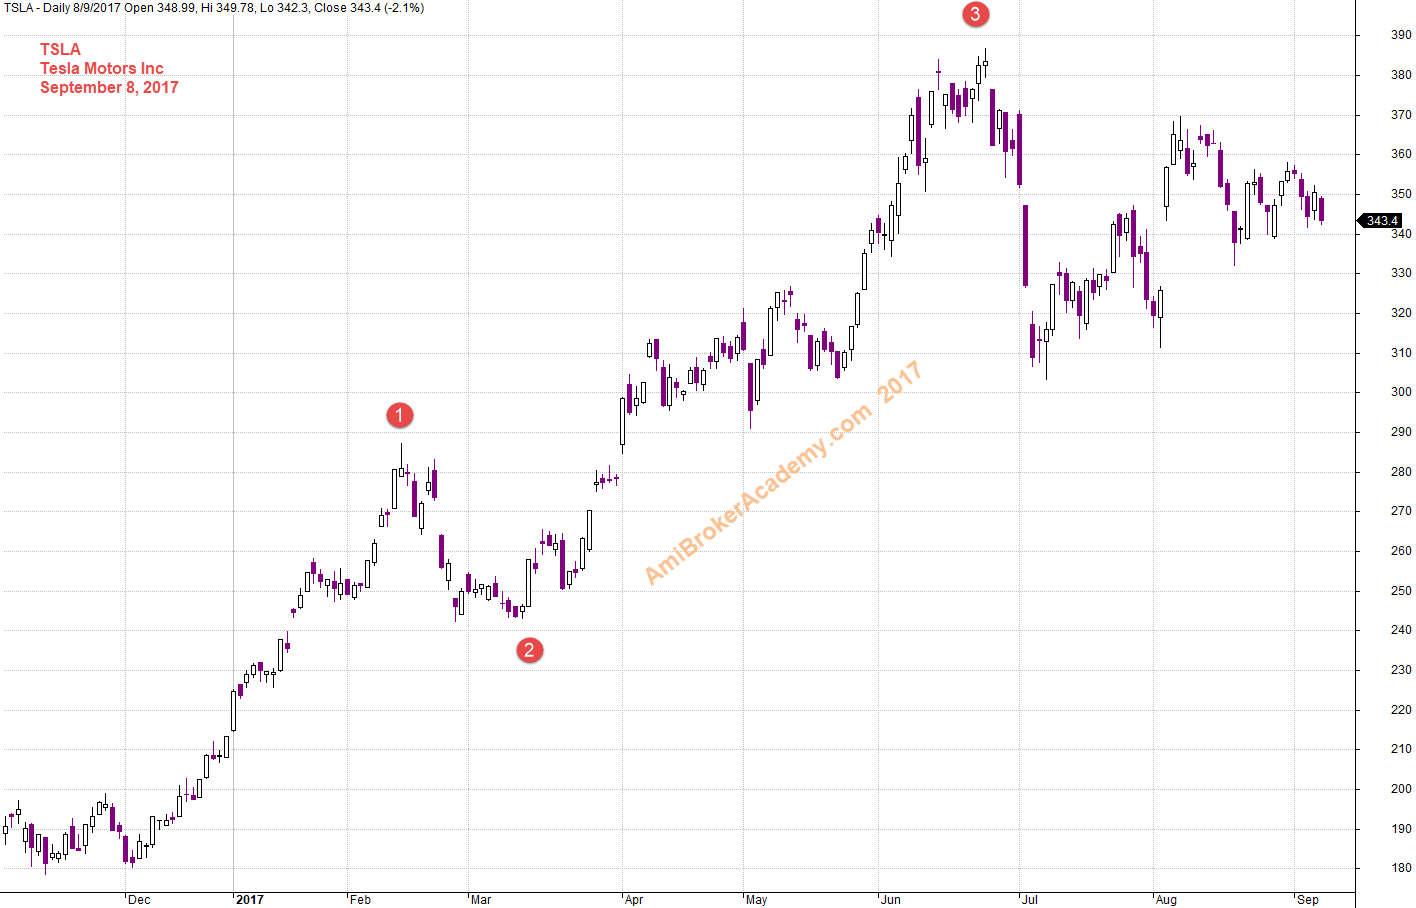
September 8, 2017 Tesla Motors and Wave Count
Tesla Motors Inc and Channel
Picture worth a thousand words, see chart for more. Connect the low and copy and paste the trendline to the top, forms channel. The Channel is slopping from bottom left to top right. Bullish trend. See the chart in more details, the price action is currently sideways.
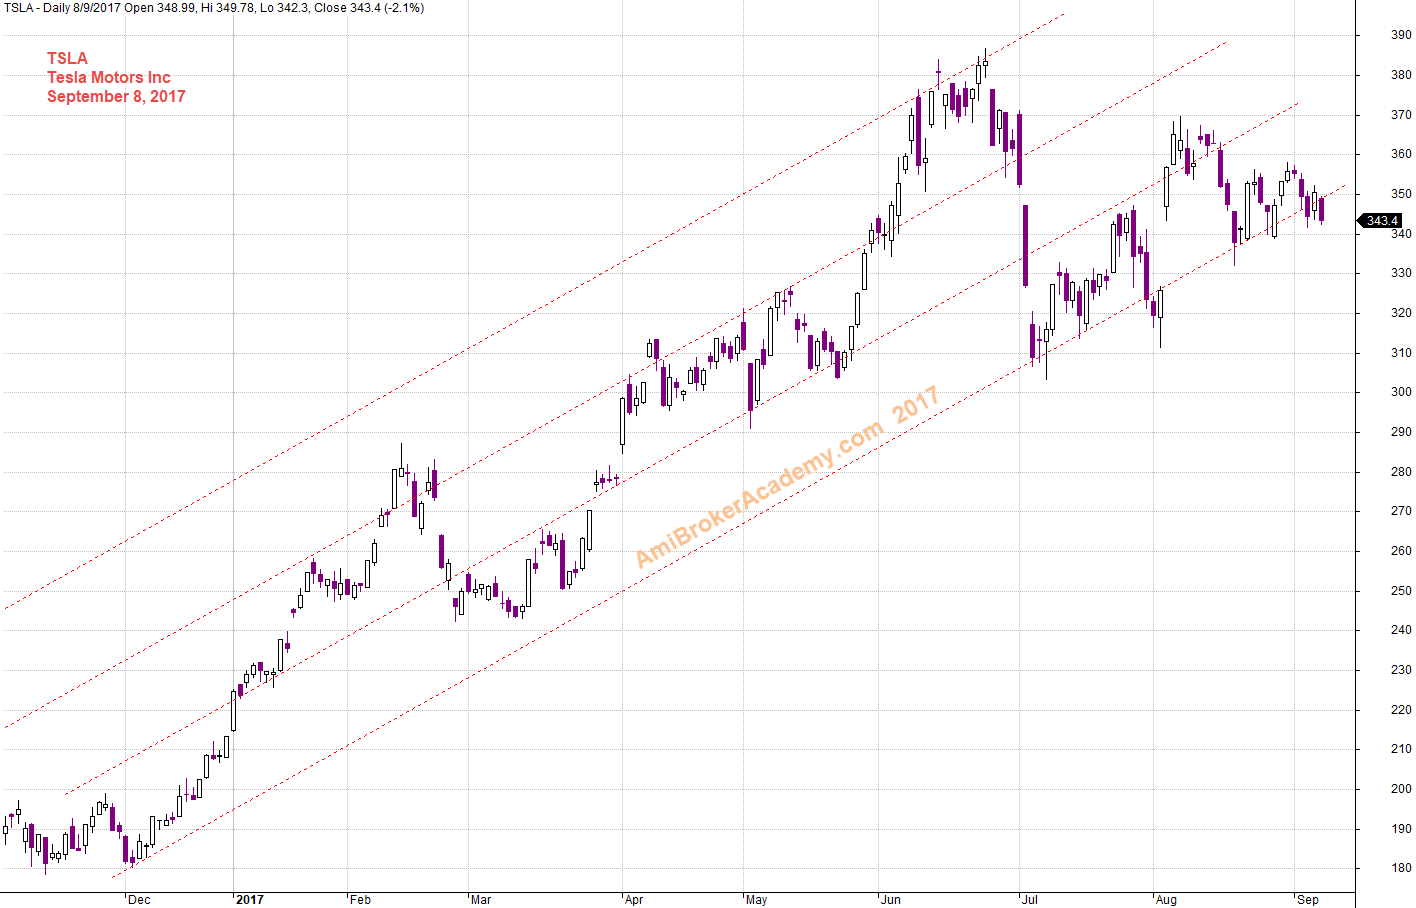
September 8, 2017 Tesla Motors and Channel
Thanks for visit the site here. You could also find free MACD scan here in this site too.
Moses
AmiBrokerAcademy.com
Disclaimer
The above result is for illustration purpose. It is not meant to be used for buy or sell decision. We do not recommend any particular stocks. If particular stocks of such are mentioned, they are meant as demonstration of Amibroker as a powerful charting software and MACD. Amibroker can program to scan the stocks for buy and sell signals.
These are script generated signals. Not all scan results are shown here. The MACD signal should use with price action. Users must understand what MACD and price action are all about before using them. If necessary you should attend a course to learn more on Technical Analysis (TA) and Moving Average Convergence Divergence, MACD.
Once again, the website does not guarantee any results or investment return based on the information and instruction you have read here. It should be used as learning aids only and if you decide to trade real money, all trading decision should be your own.