August 15, 2017
No Right No Wrong
We have analyse Boustead chart using Support Resistance, Gartley ABCD Chart pattern. As there is no right no wrong in trading analysis. Shall we see what others trading method got to say about Boustead. Have fun! Enjoy learning.
You can read about Boustead Singapore Support Resistance and Gartley ABCD in the following posting,
What Goes Up Must Come Down | F9D Boustead Singapore Share Price | AmiBrokerAcademy.com
F9D Boustead Singapore Line Chart
Picture worth a thousand words. Starting 2016, after the downflow, the price action keep forming higher high and higher low. The share price is on a bull trend.
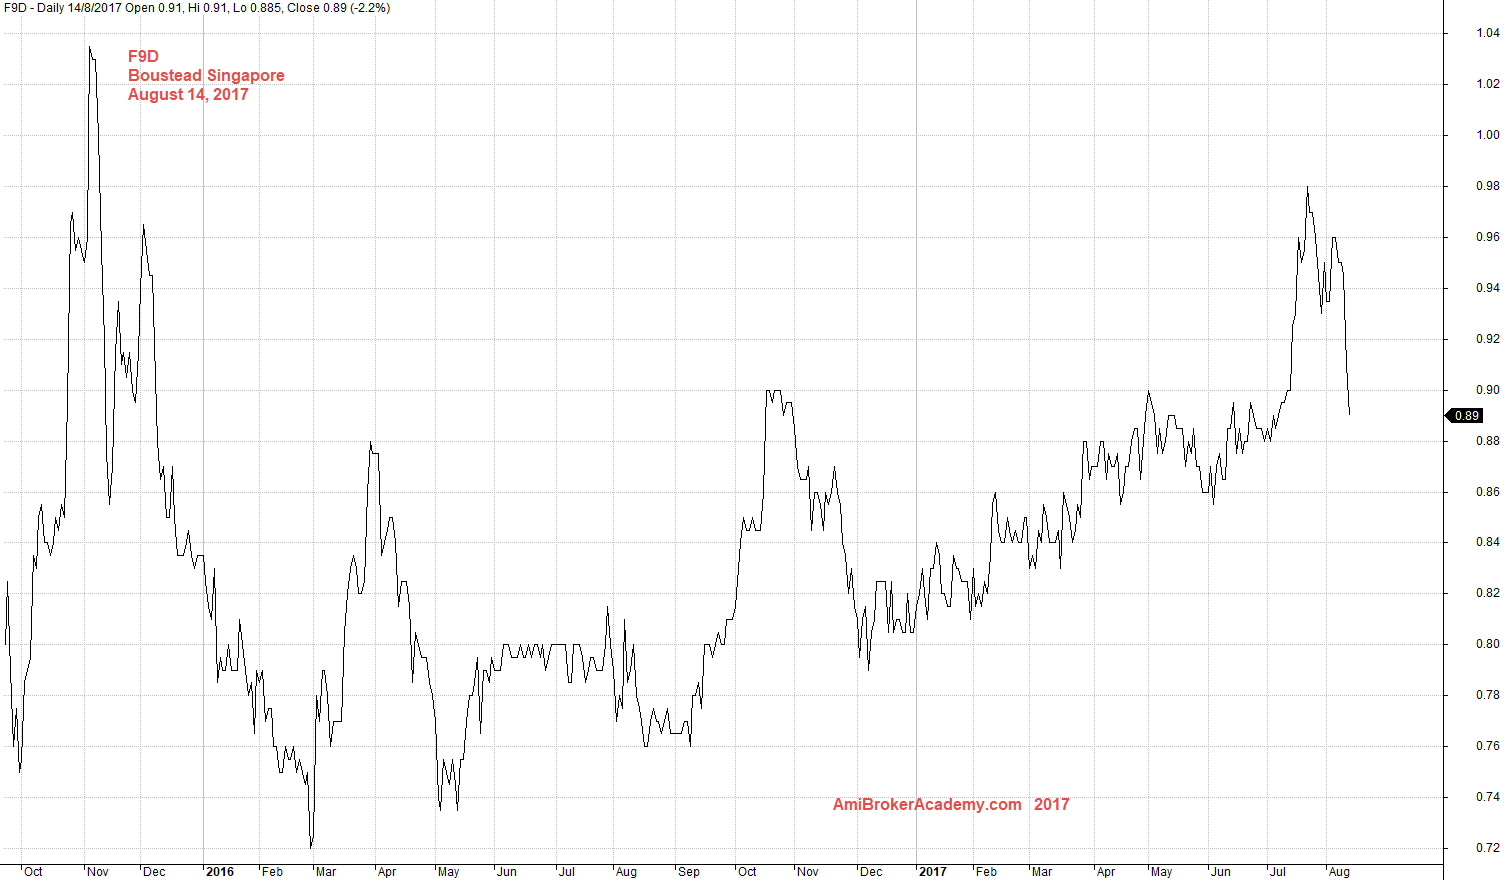
August 14, 2017 Boustead Singapore and Line Chart
F9D Boustead Singapore and MACD
MACD Cross Down signal, MACD Histogram is below zeroline, These are all bearish signs. Watch you trade.
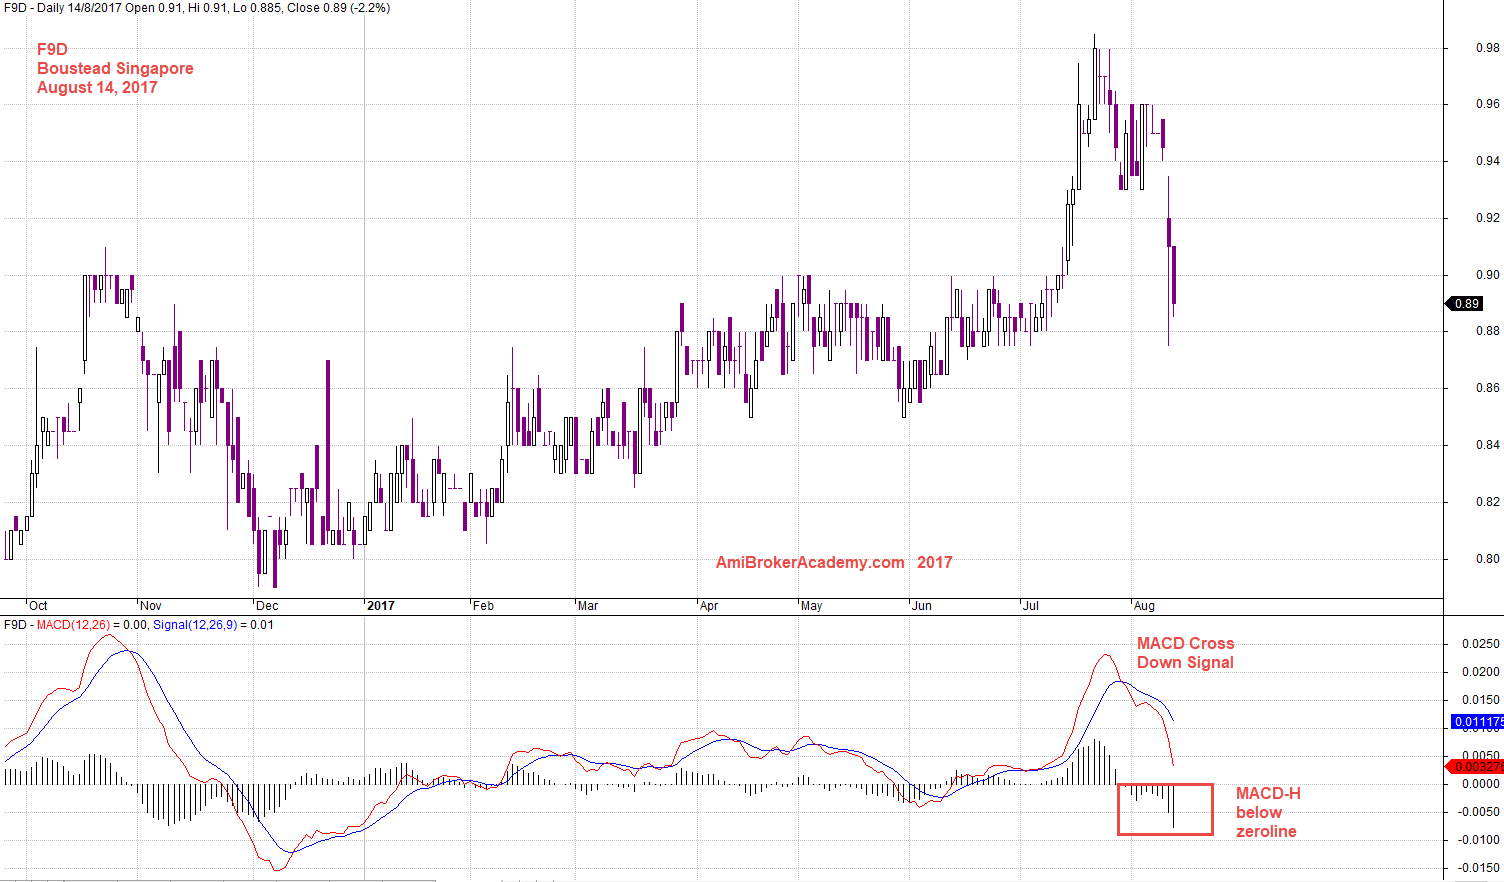
August 14, 2017 Boustead Singapore and MACD indicator
F9D Boustead Singapore and Channel
Channel is slopping up, from bottom left to top right. But see the context for details. Watch your trade.
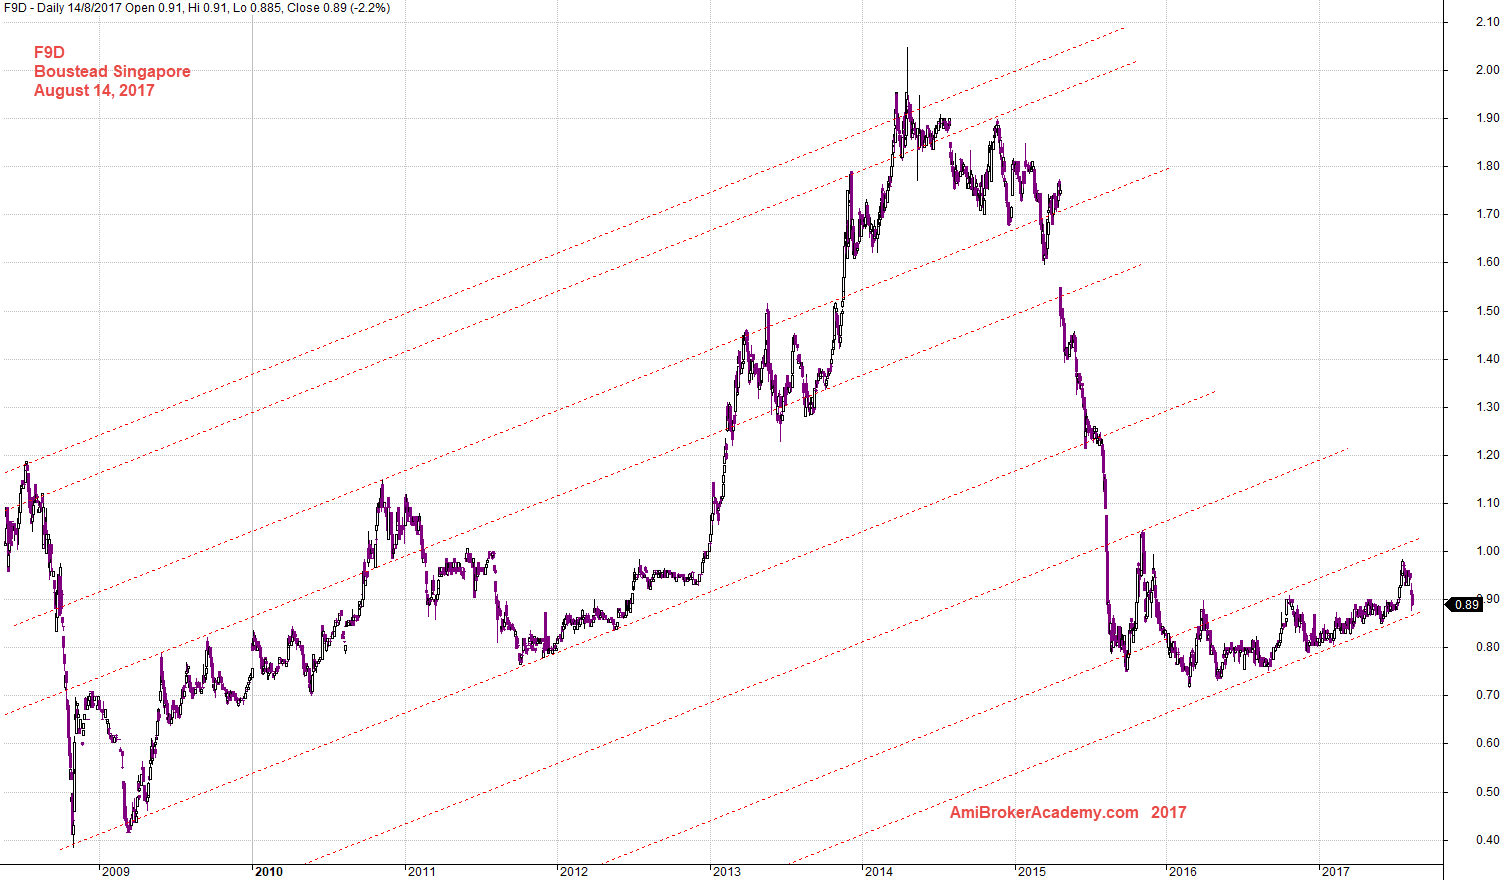
August 14, 2017 Boustead Singapore and Channel
F9D Boustead Singapore and Wave Count
It seems common that when the Elliott Wave count is up, you needless to explain much. As the wave count tells it all. True or true?
Remember no two Elliott Wave engineers’ count are the same. Have fun!
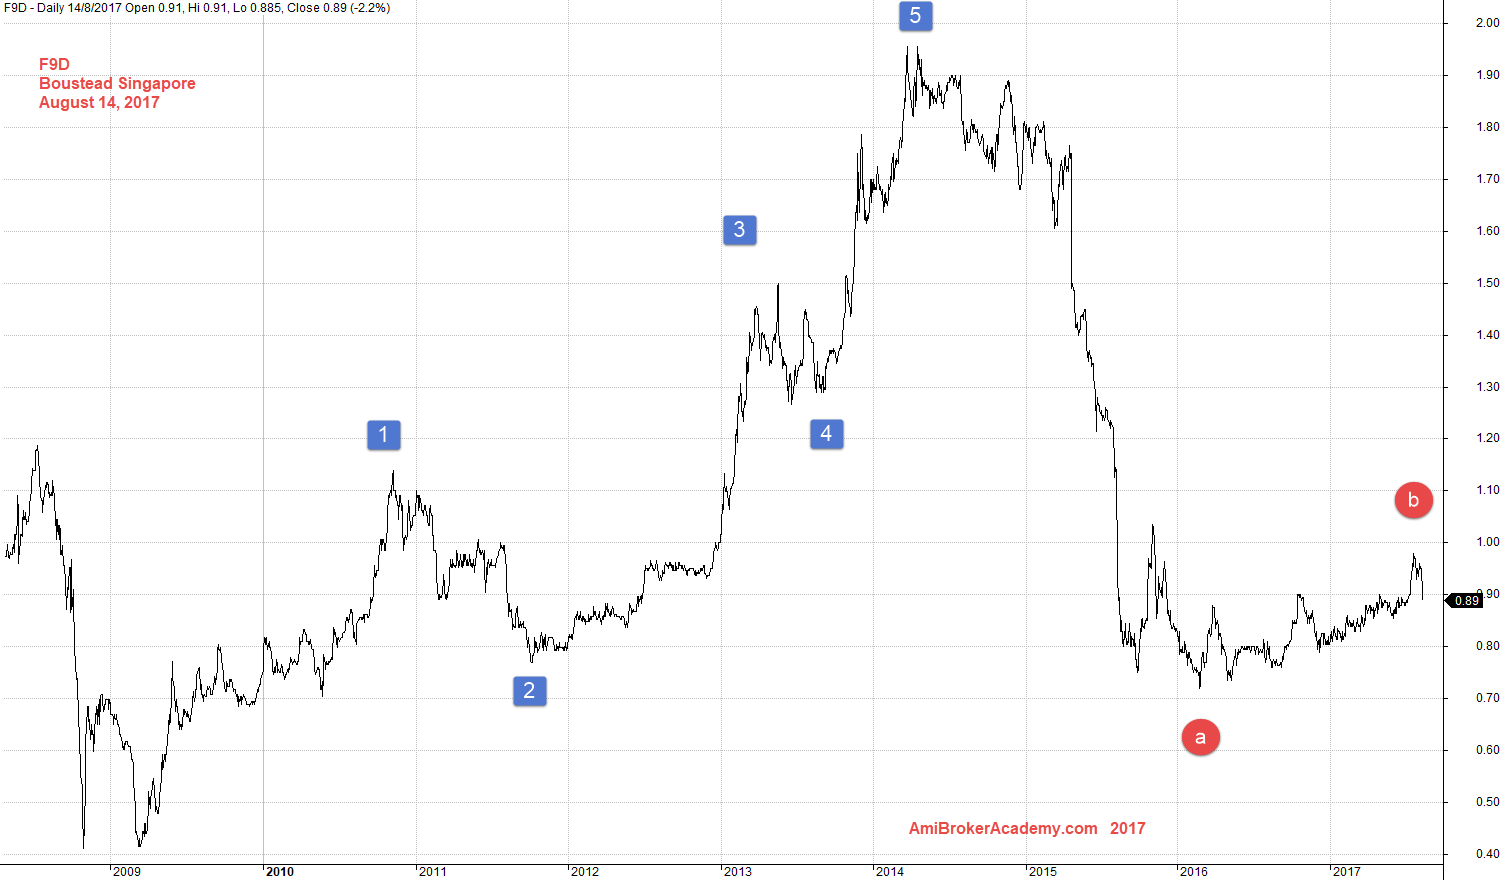
August 14, 2017 Boustead Singapore and Elliott Wave
Thanks for visit the site here. You could also find free MACD scan here in this site too.
Moses
AmiBrokerAcademy.com
Disclaimer
The above result is for illustration purpose. It is not meant to be used for buy or sell decision. We do not recommend any particular stocks. If particular stocks of such are mentioned, they are meant as demonstration of Amibroker as a powerful charting software and MACD. Amibroker can program to scan the stocks for buy and sell signals.
These are script generated signals. Not all scan results are shown here. The MACD signal should use with price action. Users must understand what MACD and price action are all about before using them. If necessary you should attend a course to learn more on Technical Analysis (TA) and Moving Average Convergence Divergence, MACD.
Once again, the website does not guarantee any results or investment return based on the information and instruction you have read here. It should be used as learning aids only and if you decide to trade real money, all trading decision should be your own.