September 9, 2017
Think Think Got More Think
Tops
Sometimes back, we share with you a half filled glass. Some may see it as half empty, and the others may think it is half full. See the following posting for more.
So, for any chart, i mean stock chart, you may see the tops or the bottoms. Tops or bottoms does not mean bullish or bearish. Okay?
So, we are going to see the tops in this posting for SPY. Have fun (learning)!
Oh! Yes! We are going to post SPY on wave counts since 2009. Watch the site here for more.
Bullish Bearish | You Decide | O39 | Oversea-Chinese Banking Corp | AmiBrokerAcademy.com
SPY SPDR S&P 500 Tops
Picture worth a thousand words. We see the price action continues to form higher high. The price is approaching 250.
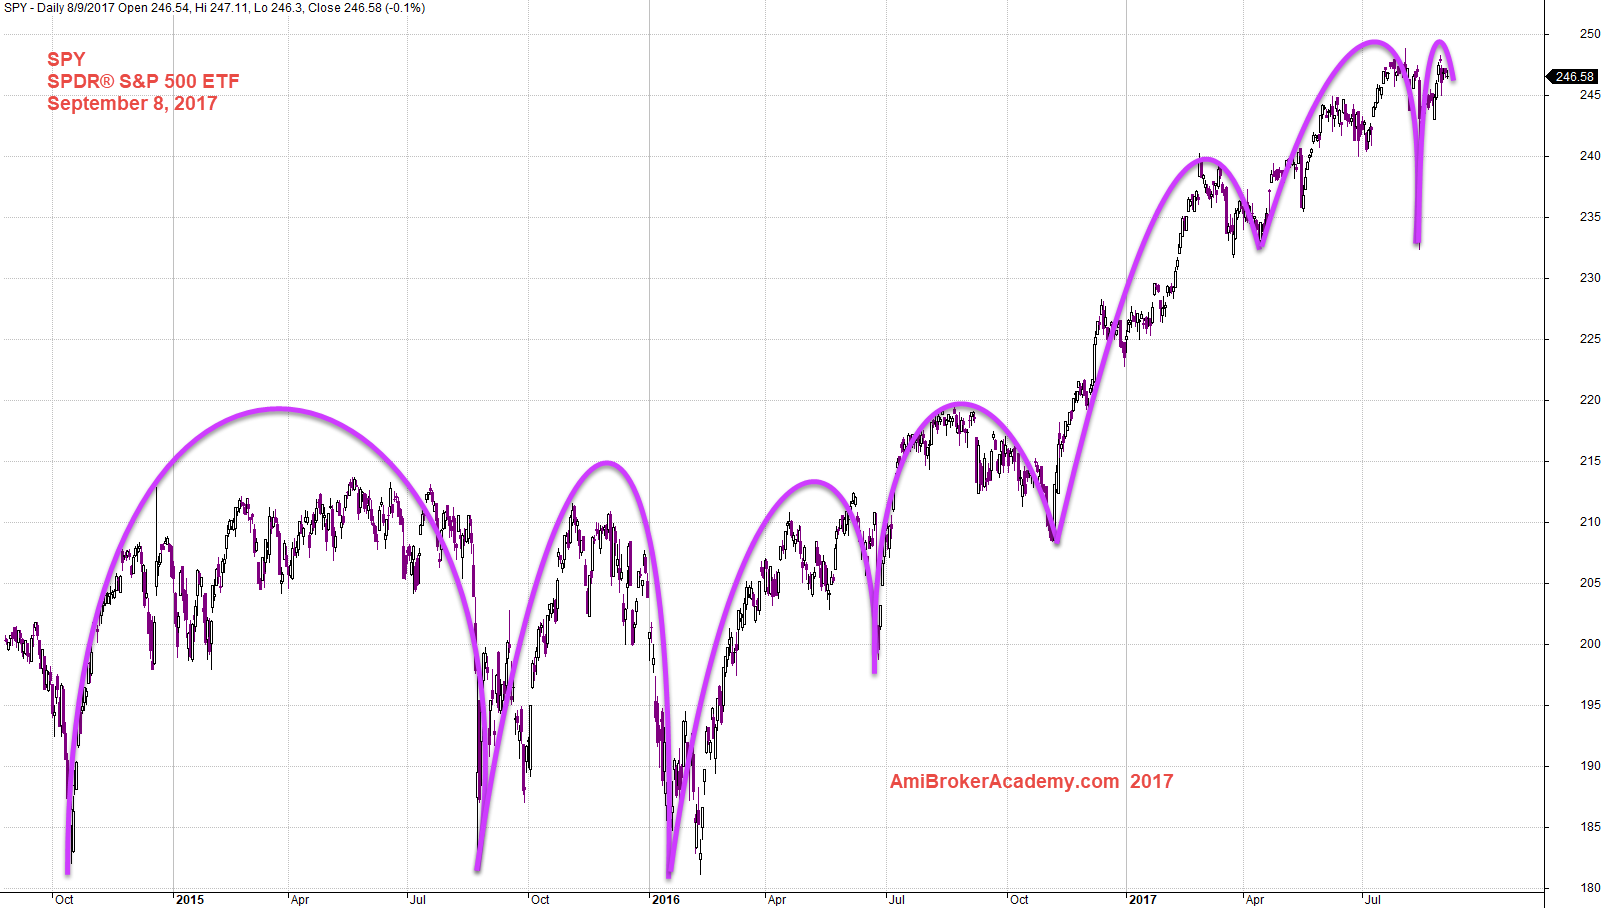
September 8, 2017 SPDR S&P 500 and Tops
Thanks for visit the site here. You could also find free MACD scan here in this site too.
Moses
AmiBrokerAcademy.com
Disclaimer
The above result is for illustration purpose. It is not meant to be used for buy or sell decision. We do not recommend any particular stocks. If particular stocks of such are mentioned, they are meant as demonstration of Amibroker as a powerful charting software and MACD. Amibroker can program to scan the stocks for buy and sell signals.
These are script generated signals. Not all scan results are shown here. The MACD signal should use with price action. Users must understand what MACD and price action are all about before using them. If necessary you should attend a course to learn more on Technical Analysis (TA) and Moving Average Convergence Divergence, MACD.
Once again, the website does not guarantee any results or investment return based on the information and instruction you have read here. It should be used as learning aids only and if you decide to trade real money, all trading decision should be your own.