April 5, 2017
Moses’ US Stock MACD Stock Screening
Moses at AmiBrokerAcademy.com uses charting software AmiBorker and AmiBroker’s AFL to screen through 6,300 stocks store in the database. These data comes from yahoo! Finance web portal. AmiBroker has a tool, AmiQuote to retrieve the data from Yahoo! Finance and store on the database on your pc local hard drive. Yahoo! Fiance provides free stock data for most of the stock exchange around the world.
The Following is the April 3, 2017 US Stock MACD Screening Signals
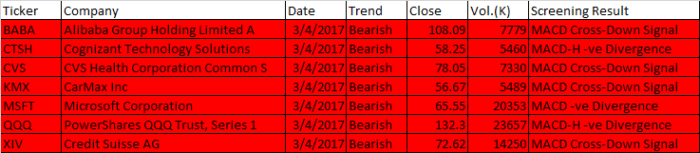
April 3, 2017 US Stock MACD Screening Signals
| Ticker | Company | Date | Trend | Close | Vol.(K) | Screening Result |
| BABA | Alibaba Group Holding Limited A | 3/4/2017 | Bearish | 108.09 | 7779 | MACD Cross-Down Signal |
| CTSH | Cognizant Technology Solutions | 3/4/2017 | Bearish | 58.25 | 5460 | MACD-H -ve Divergence |
| CVS | CVS Health Corporation Common S | 3/4/2017 | Bearish | 78.05 | 7330 | MACD Cross-Down Signal |
| KMX | CarMax Inc | 3/4/2017 | Bearish | 56.67 | 5489 | MACD Cross-Down Signal |
| MSFT | Microsoft Corporation | 3/4/2017 | Bearish | 65.55 | 20353 | MACD -ve Divergence |
| QQQ | PowerShares QQQ Trust, Series 1 | 3/4/2017 | Bearish | 132.3 | 23657 | MACD-H -ve Divergence |
| XIV | Credit Suisse AG | 3/4/2017 | Bearish | 72.62 | 14250 | MACD Cross-Down Signal |
MACD Screening Signals
The AFL script scans through the entire database to identify the following MACD signals.
- MACD line crosses above MACD signal – Bullish trend
- MACD line crosses above zero line – Bullish trend
- MACD Histogram +ve Divergence – Bullish trend
- MACD line crosses below MACD signal – Bearish trend
- MACD line crosses below zero line – Bearish trend
- MACD Histogram -ve Divergence – Bearish trend
- Volume traded greater 5,000,000 shares
- Stock between 51 dollars to 250 dollars.
.
Moses
AmiBrokerAcademy.com
Disclaimer
The above result is for illustration purpose. It is not meant to be used for buy or sell decision. We do not recommend any particular stocks. If particular stocks of such are mentioned, they are meant as demonstration of Amibroker as a powerful charting software and MACD. Amibroker can program to scan the stocks for buy and sell signals.
These are script generated signals. Not all scan results are shown here. The MACD signal should use with price action. Users must understand what MACD and price action are all about before using them. If necessary you should attend a course to learn more on Technical Analysis (TA) and Moving Average Convergence Divergence, MACD.
Once again, the website does not guarantee any results or investment return based on the information and instruction you have read here. It should be used as learning aids only and if you decide to trade real money, all trading decision should be your own.