June 5, 2016
Golden Agri Resources Stock Analysis
Was it any confused for you to see the Gartley 222 sell signal? If you have been following the website, you probably had read our analysis. In March 2016, we did an analysis and we saw there were opportunity for a Gartley 222 sell. The price stop at 0.44 and started to fall. Chart tell the thousand words. The price did a tracement or pullback till 0.34. However, as an experience trader you are aware that all setup can fail. The key here is manage the risk. Check the link for more details, Trade What You See | Gartley 222 Sell Pattern | Golden Agri Resources.
Now, looks like the price action is continuing to form a bearish three drive pattern as Larry larry Pesavento termed it.
Have fun!
Note: the price action keeps breakout higher.
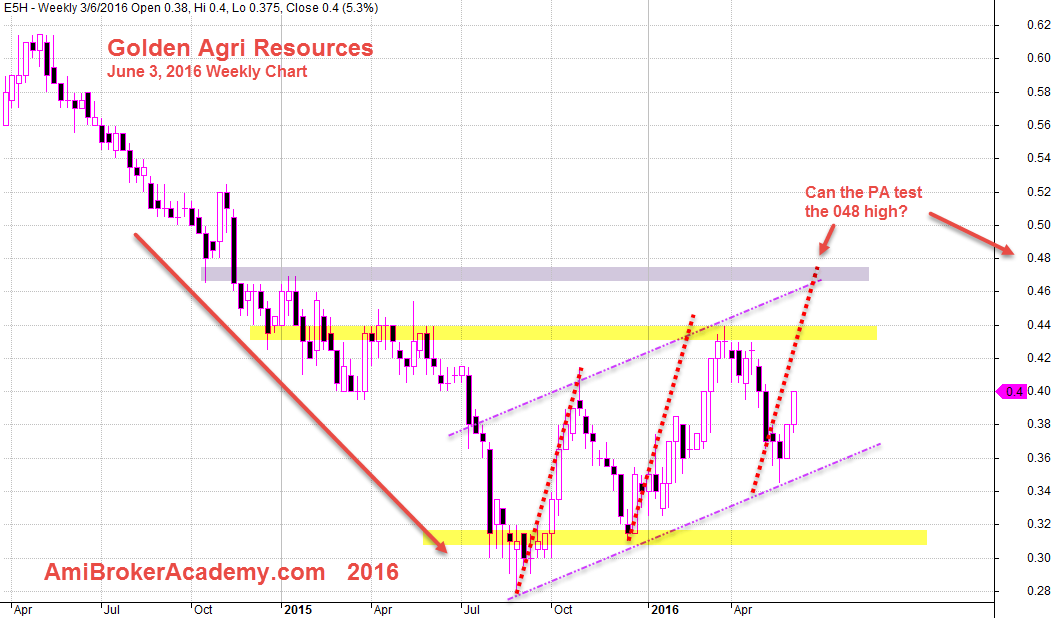
June 3, 2016 Golden Agri Resources Weekly Chart
Thanks for visiting the site, you can find many other analysis and concepts on this site. Have fun!
Moses Stock Analysis and Scan
Disclaimer: All information, data and material contained, presented, or provided on amibrokeracademy.com is for educational purposes only. It is not to be construed or intended as providing trading or legal advice. Decisions you make about your trading or investment are important to you and your family, therefore should be made in consultation with a competent financial advisor or professional. We are not financial advisor and do not claim to be. Any views expressed here-in are not necessarily those held by amibrokeracademy.com. You are responsible for your trade decision and wealth being.
The site uses powerful charting software, AmiBroker charting software.