February 11, 2018
What a Great Start 2018 – Think Think Got More Things
What a great start for 2018, after the Paris World Economy Forum, the market start to think think, and think think got more things. For TA, Technical Analysis sometime we just don’t think too much. We study the chart and see what the chart has to tell us. From chart, very clear cut, the MA Band slopping up, makes a turn and begin to slop down. Now is at the turning point, the MA band open up and a bit flat, a bit down. There are plenty of room for the price action. There are only three direction, sideways, down, and up. So be patient and monitor.
It is quite clear at this point the price action has been resisted by the MA Band. …
Asia Market is Affected!
It may get worst that many of the traders are taking time off for the next two weeks. As there will me a Golden Week in China next week. It is a fifteen days Chinese New Year celebration. Although the tradition celebration has died off, but people still taking holiday for this time. In fact this will be the worst time to travel to China, you might be caught in the human jam everywhere. Google yourself the up to date people flow condition.
Just a note, there are a few Golden Week in China every year, Chinese New Year is one of them. And may be the most busier one.
The point is many trader may be not at their desk trading.
So, can Asia leading the correction now. The Asia traders want cash for their New Year Ang Pow
US Stock Analysis
^DJI Dow Jones Industrial Average Index and MA Band
Dow has crossed 26500, but has a bear bar, a sell off followed a gap down on the next trading day; market still think the price is too high. This forms a leg 1, a struggle by those whom want to ride it high. Very quickly the market prove them wrong by a huge bar close below and touch the MA band, a 34 MA band. The market did not stop here, the index closed further down by crossed below the MA band.
The market has a big “fight’, a long bar up and a doji, indecision. Finally the bull gives in and the bear takes over. It has a big sell off again, the Dow Index closes below 24,000 level. What! From 26,500 and now 24,000, a 2,500 points down in just less than ten days. Remember DJI took more than a month to climb up from 24,000 and it only takes only about a week to bring it back again, a zero gain effort.
Manage your risk!
Powerful Chart Software – AmiBroker
The following chart is produced using AmiBroker charting software. It is a powerful chart software. You plot the stocks you are interested all in one chart, as long as you still could read them. See chart below.
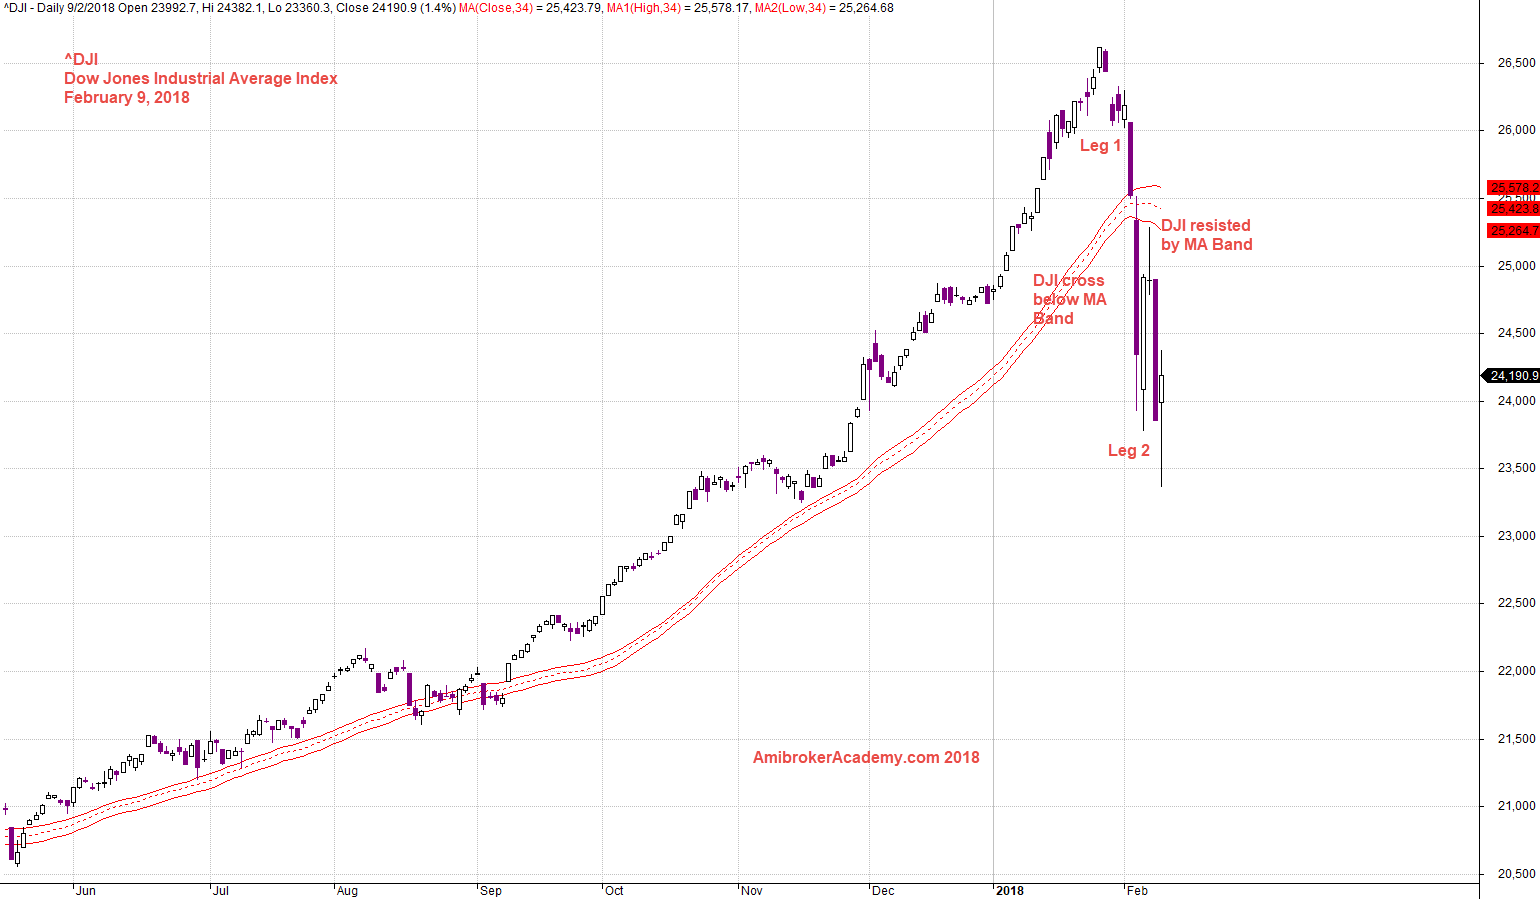
February 9, 2018 Dow Jones Industrial Average Index and MA Band
Moses
AmiBrokerAcademy.com
Disclaimer
The above result is for illustration purpose. It is not meant to be used for buy or sell decision. We do not recommend any particular stocks. If particular stocks of such are mentioned, they are meant as demonstration of Amibroker as a powerful charting software and MACD. Amibroker can program to scan the stocks for buy and sell signals.
These are script generated signals. Not all scan results are shown here. The MACD signal should use with price action. Users must understand what MACD and price action are all about before using them. If necessary you should attend a course to learn more on Technical Analysis (TA) and Moving Average Convergence Divergence, MACD.
Once again, the website does not guarantee any results or investment return based on the information and instruction you have read here. It should be used as learning aids only and if you decide to trade real money, all trading decision should be your own.