January 19, 2018
Singapore Stock Analysis
The Straits Times Index Quarter and Year High Low
STI finally retest the 2015 high, but the index fail to stay high and begin to decline. Look at the chart, and study the trend. In 2015, STI after much struggle and hit 3550 level, right after the index begin to slopping down and never return. This resulted a great start of 2016. A low in 2016, thereafter STI slow to work it way back up. It took more than a year. More than a year to retest the high of 2015, 3550. To be exact 3549.85.
What is your conclusion, after learn from the history. Will STI repeat the story again? Wait and see. See STI pull back to the same low of 2017 last quarter. Stay watch.
Manage your risk.
Powerful Chart Software – AmiBroker
The following chart is produced using AmiBroker charting software. It is a powerful chart software. You plot the stocks you are interested all in one chart, as long as you still could read them. See chart below.
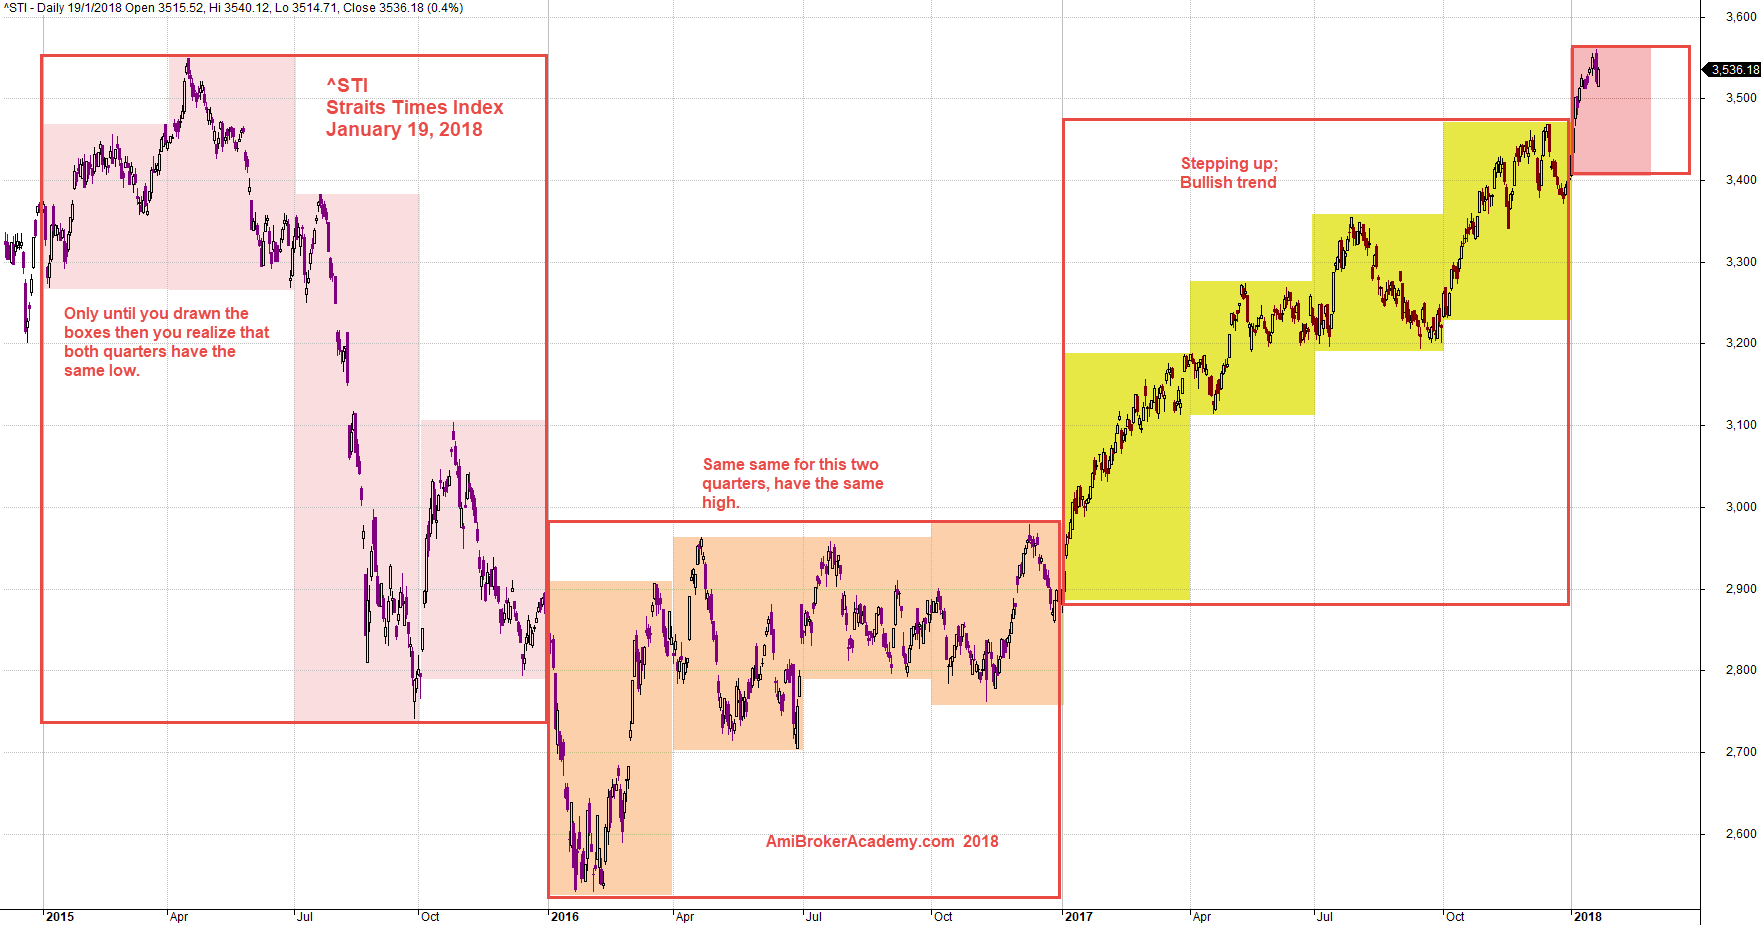
January 19, 2018 The Straits Times Index and Quarter and Year High Low
The Straits Times Index Retest 2015 High
See chart for more.
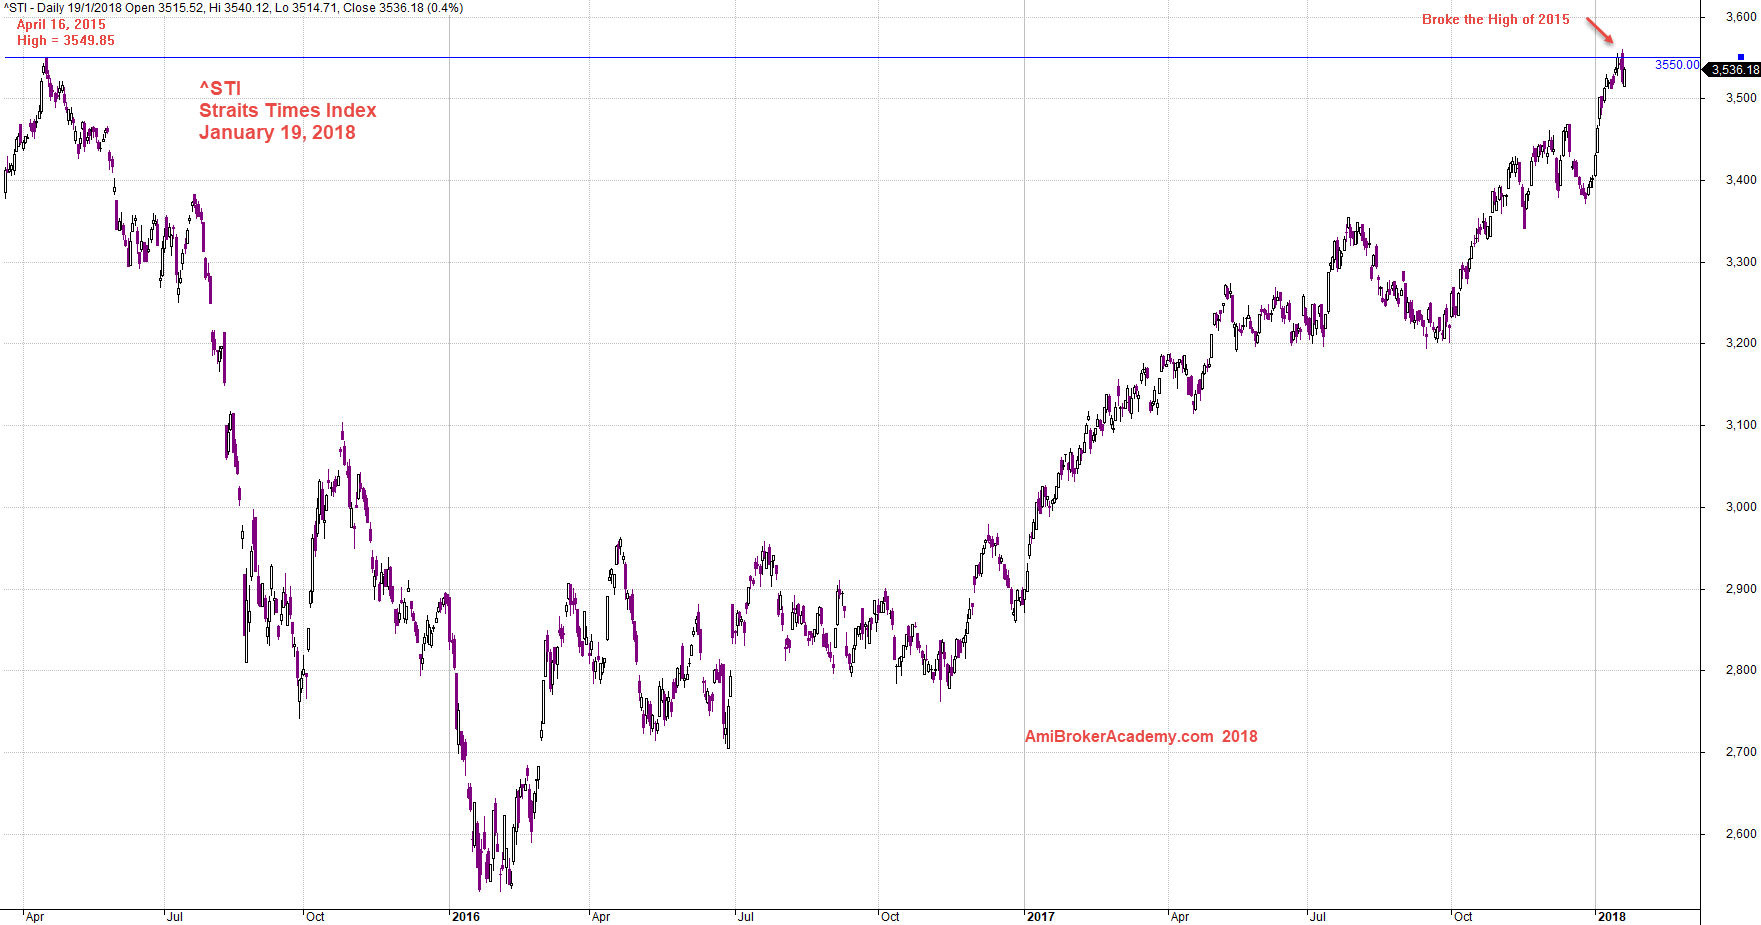
January 19, 2018 The Straits Times Index Breakout 2015 High of 3549.85 Level
The Straits Times Index and Channel
Study the chart for channel and plan the trade.
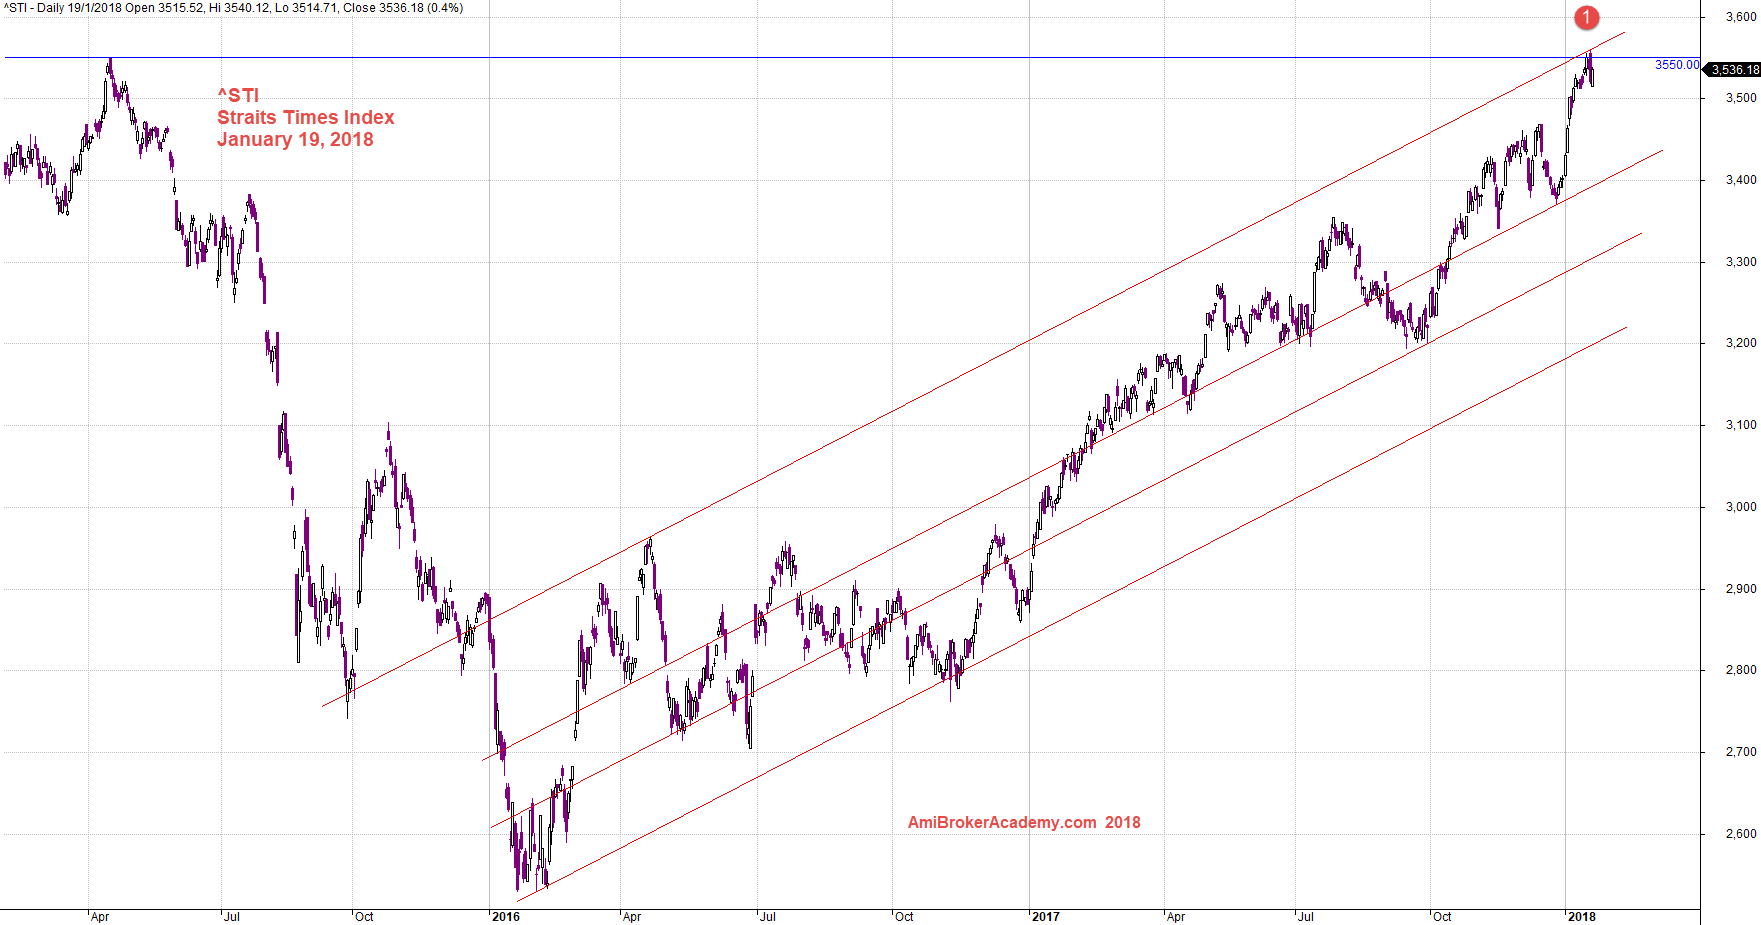
January 19, 2018 The Straits Times Index and Channel
Moses
AmiBrokerAcademy.com
Disclaimer
The above result is for illustration purpose. It is not meant to be used for buy or sell decision. We do not recommend any particular stocks. If particular stocks of such are mentioned, they are meant as demonstration of Amibroker as a powerful charting software and MACD. Amibroker can program to scan the stocks for buy and sell signals.
These are script generated signals. Not all scan results are shown here. The MACD signal should use with price action. Users must understand what MACD and price action are all about before using them. If necessary you should attend a course to learn more on Technical Analysis (TA) and Moving Average Convergence Divergence, MACD.
Once again, the website does not guarantee any results or investment return based on the information and instruction you have read here. It should be used as learning aids only and if you decide to trade real money, all trading decision should be your own.