January 9, 2017
Gazing the Crystal Ball or Using Fengshui Reading to See the 2017 Stock Direction …
Next year, after January 28, 2017 Chinese New Year the Singapore stocks market will be uptrend, downtrend or sideways. Will it all depends. Depending on the local economy, the global economy, the weather, and many many more reason.
In fact, if you will ask the professional traders they will smile and tell you. There is no good trend then the trend coming. So, do not worry and be happy and trade and make money. Besides that even you might be right, but you may still lost.
Singapore Stock Analysis
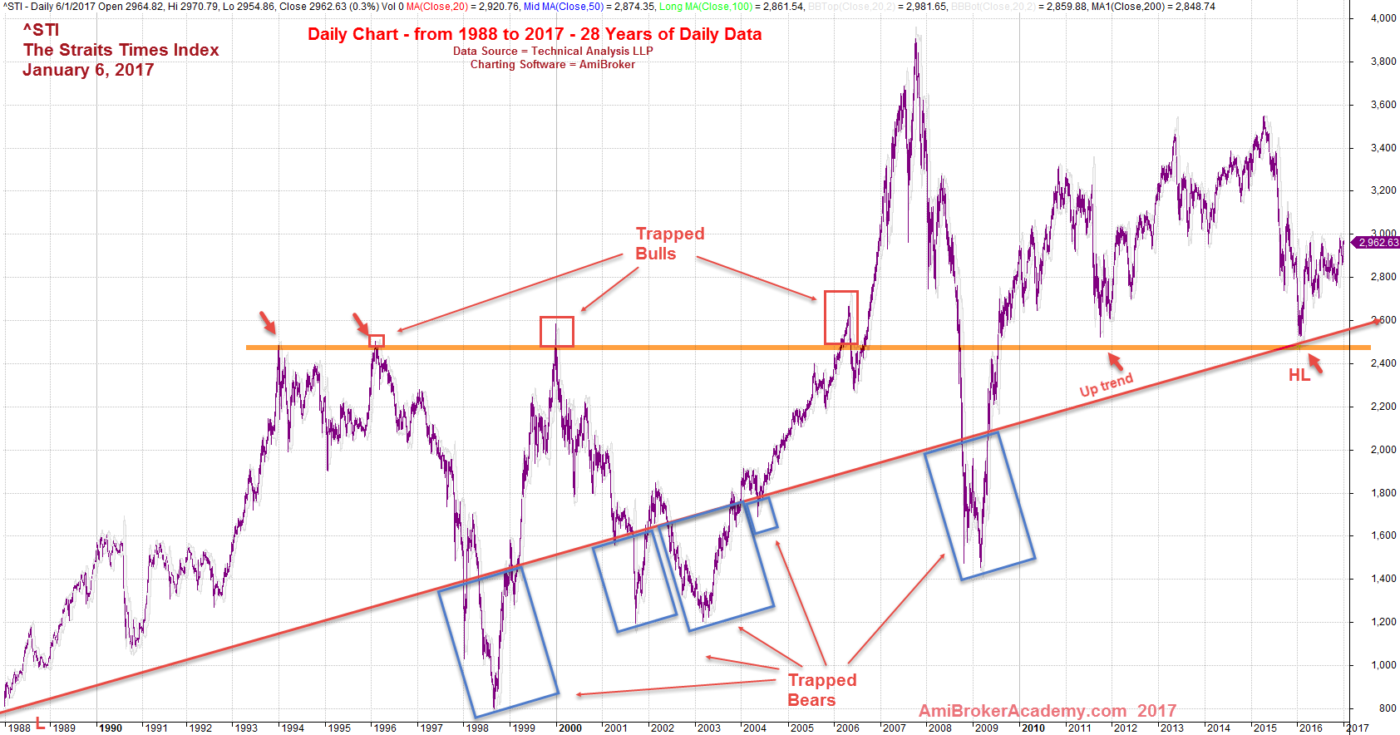
^STI | The Straits Times Index 28 years Daily Data
We see the STI swing low to high, or form low and higher low. When you connect the low and the last higher low, all the STI fall below the trendline will be seen as the bears been trapped. And when you connect the highs the horizontal line, the spikes consider as bull trapped.
The price action is bouncing off and above a critical level; the STI is being supported.
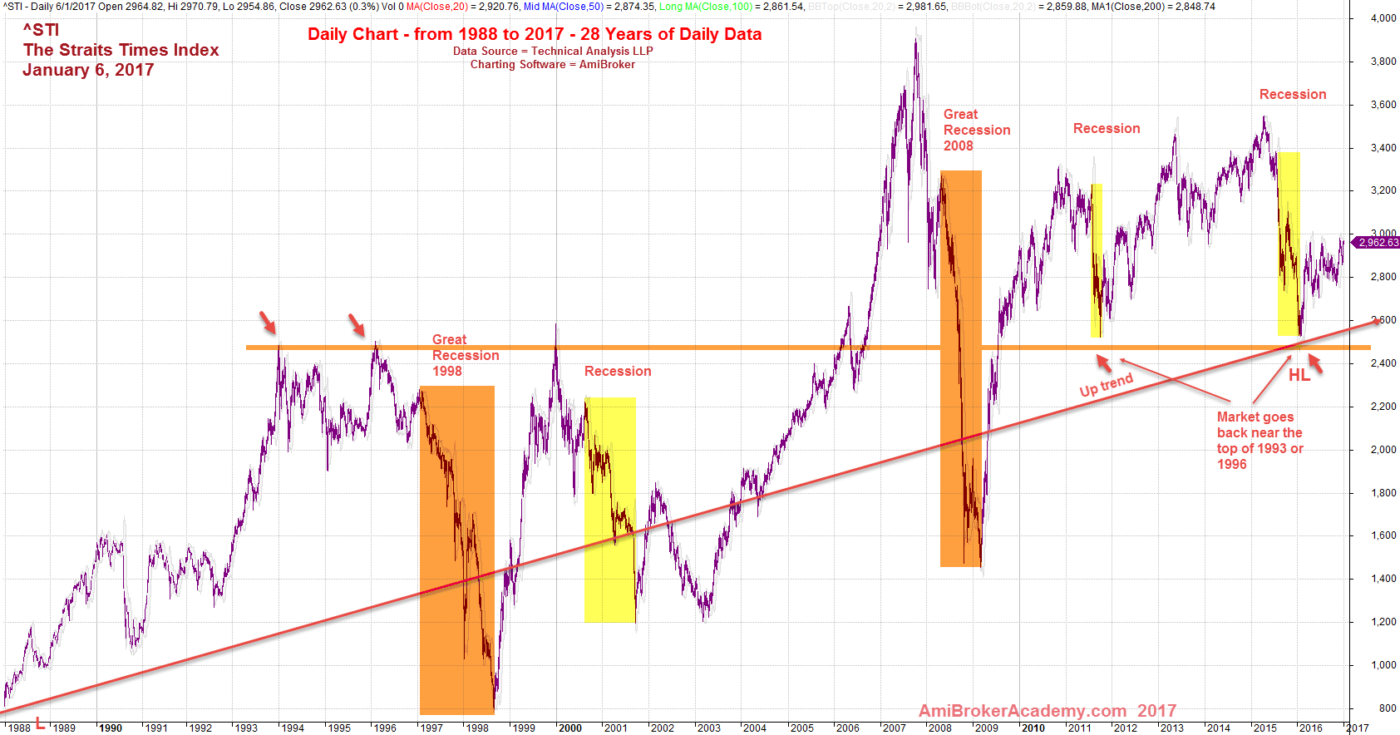
January 7, 2017 The Straits Times 28 Years of Data and Trend
^STI | The Straits Times Index 28 years Daily Data
How to find important level the level will be the future support to prevent STI from travelling South? See chart for details, picture worth a thousand words.
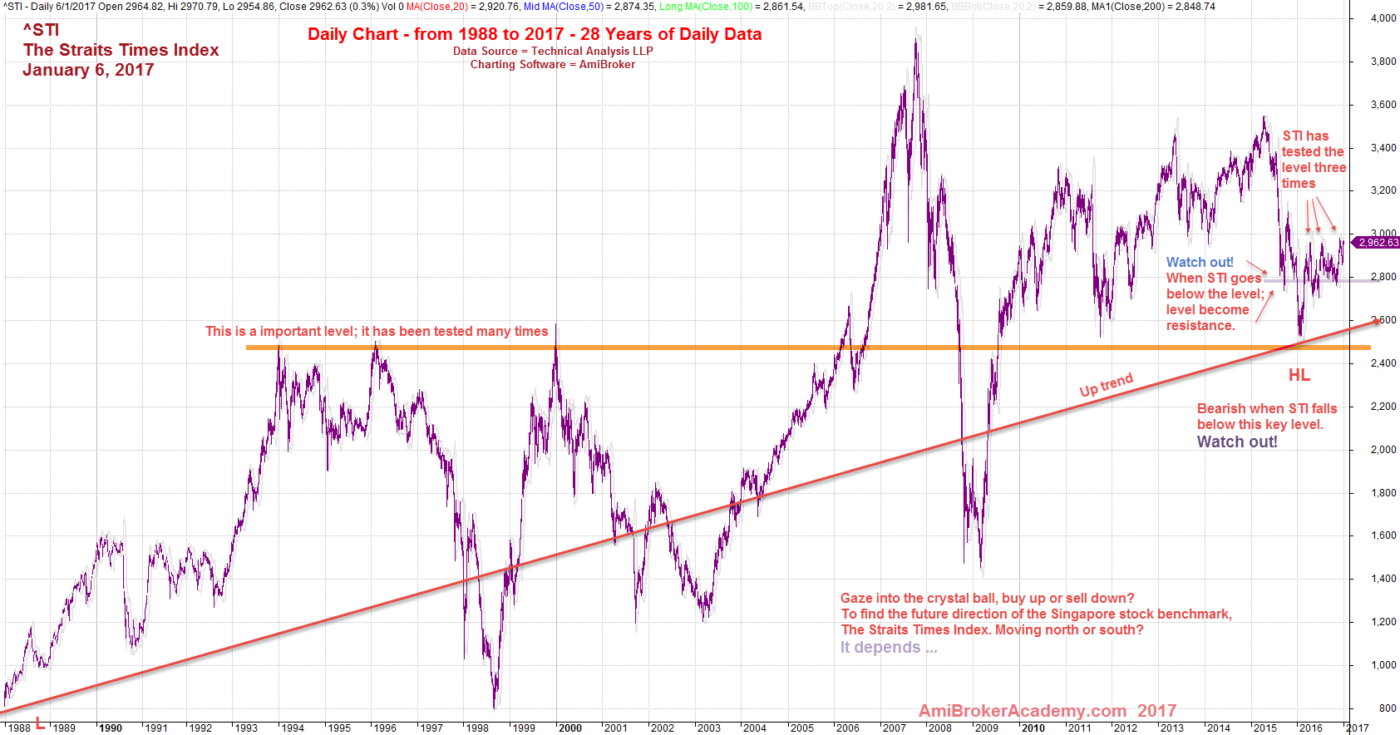
January 7, 2017 The Straits Times Index and 28 Years of Data
^STI | The Straits Times Index 28 years Daily Data
We can see STI was struggle, retested the same top for three times as at to-date. Bulls and Bears are now confused the trend direction, when STI breakout and rally. The bulls try to buy low, and bears may be buy to cover lost. STI will rush up. Of course it depends.
January 7, 2017 The Straits Times Index and 28 years of data
Moses Stock Desk
AmiBrokerAcademy.com
Disclaimer:
The discussion here is for educational purposes only. All information, data, symbols and trading ideas discussed hereby are the author or authors intend to demonstrate or illustrate purposes only. These are not recommendations or advice. It is not to be construed or intended as providing trading or legal advice.
Besides that this discussion is not an offer or solicitation of any kind in any jurisdiction where any AmiBrokerAcademy.com or its affiliate is try to do business.
Please note that active trading is not suitable for everyone. Any decisions you make about your trading or investment are important to you and your family, therefore should be made in consultation with a competent financial advisor or professional. We are not financial advisor and do not claim to be one.
Any views expressed here-in are not necessarily those held by amibrokeracademy.com.