July 16, 2017
The Bottom Line
The market’s biggest winners often add to gains in the last days of a quarter because fund managers buy back these issues in an accounting game that makes their quarterly performance look stronger. Traders can piggyback on this dynamic through positions with tight stops, keeping in mind that positive seasonality ends after the first trading day of the new quarter.
Free Singapore Stocks MACD signals. Free MACD Scan for Trading Day Close July 10 to July 14, 2017
Welcome to Moses’s Stock Scan at AmiBrokerAcademy.com.
The following are Singapore stocks five-day MACD screening using Amibroker script . These stocks screening has reduce to stocks with a minimum value of 30 cents with at least 8,000,000 shares changed hands.
Why Using Script to Screen Stocks?
To narrow down to only a few stocks for your limited capital and ensure the stocks might move in the short term. And it only takes a few minutes to go through the entire database that have contains nearly nine symbols.
We Look For the Following Four MACD Signals:
- Crossovers – Sell Strategy, MACD crosses below the signal line. Buy Strategy, MACD rallies above the signal line. It is advisable to wait for confirmation to reduce possible whipsaw.
- Divergence – The security price action diverges from the MACD. It signals the end of the current trend.
- Cross Zero Line – MACD moves above or below zero line. Upward trend: Cross above zero line, short MA above long MA. Downward trend: Cross below zero line, short MA below long MA.
- Dramatic rise or fall – MACD rises or decline dramatically – when the shorter moving average pulls away from the longer-term moving average – Oversold or Overbought.
We vary the selection criteria, ie narrow down to 8,000,000 stocks changed hands.
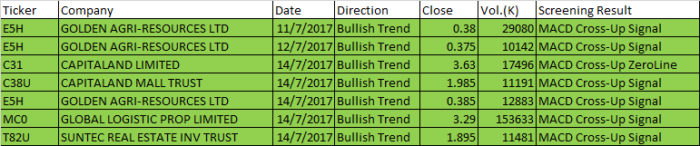
July 10 to July 14, 2017 Singapore Stock MACD Signals
| Ticker | Company | Date | Direction | Close | Vol.(K) | Screening Result |
| E5H | GOLDEN AGRI-RESOURCES LTD | 11/7/2017 | Bullish Trend | 0.38 | 29080 | MACD Cross-Up Signal |
| E5H | GOLDEN AGRI-RESOURCES LTD | 12/7/2017 | Bullish Trend | 0.375 | 10142 | MACD Cross-Up Signal |
| C31 | CAPITALAND LIMITED | 14/7/2017 | Bullish Trend | 3.63 | 17496 | MACD Cross-Up ZeroLine |
| C38U | CAPITALAND MALL TRUST | 14/7/2017 | Bullish Trend | 1.985 | 11191 | MACD Cross-Up Signal |
| E5H | GOLDEN AGRI-RESOURCES LTD | 14/7/2017 | Bullish Trend | 0.385 | 12883 | MACD Cross-Up Signal |
| MC0 | GLOBAL LOGISTIC PROP LIMITED | 14/7/2017 | Bullish Trend | 3.29 | 153633 | MACD Cross-Up Signal |
| T82U | SUNTEC REAL ESTATE INV TRUST | 14/7/2017 | Bullish Trend | 1.895 | 11481 | MACD Cross-Up Signal |
Moses
AmiBrokerAcademy.com
Disclaimer
The above result is for illustration purpose. It is not meant to be used for buy or sell decision. We do not recommend any particular stocks. If particular stocks of such are mentioned, they are meant as demonstration of Amibroker as a powerful charting software and MACD. Amibroker can program to scan the stocks for buy and sell signals.
These are script generated signals. Not all scan results are shown here. The MACD signal should use with price action. Users must understand what MACD and price action are all about before using them. If necessary you should attend a course to learn more on Technical Analysis (TA) and Moving Average Convergence Divergence, MACD.
Once again, the website does not guarantee any results or investment return based on the information and instruction you have read here. It should be used as learning aids only and if you decide to trade real money, all trading decision should be your own.