April 20, 2017
^N225 Nikkei 225 Index and 34 EMA Wave
The index has now breakout the support and fallen in below the support. Will the index test the last November low? Will see.
This is the near turn view.
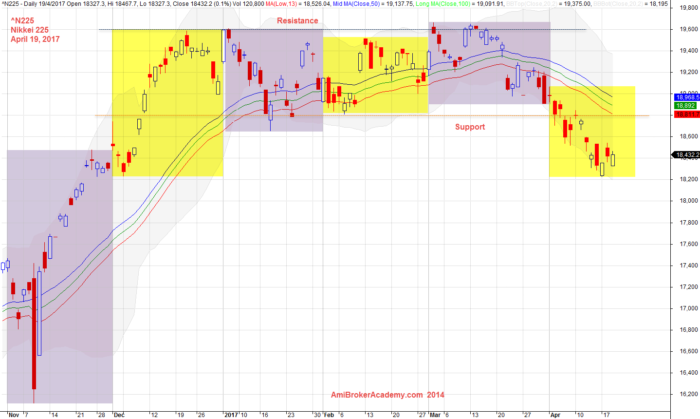
April 19, 2017 Nikkei 225 and 34 EMA Wave
^N225 Nikkei 225 Index 2014 to 2017
Picture worth a thousand words, see how the index move from 2014 till 2017. The index went from low in 2014 ti the peak of 2015 and fail to the low of 2016. The good thing is the low of 2016 was higher than 2014 low, but it was definitely lower than 2015 low. This is from the uptrend to a reversal. May be we now call it a big pullback. As the index bounced off after the low of 2016. Unfortunately, the index is resisted by the high of 2016 high.
Can the index breakout higher than the 2016 high? Will see.
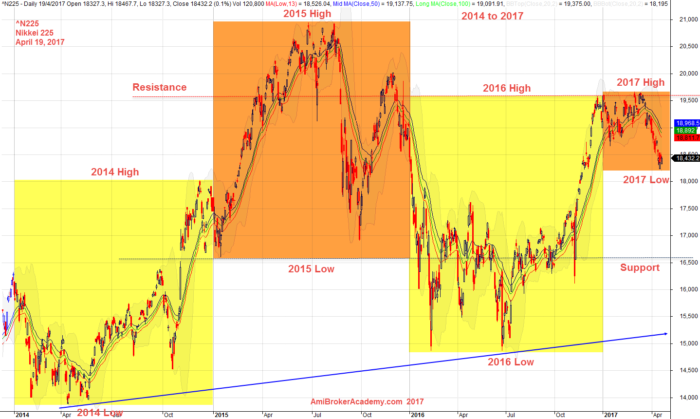
April 19, 2017 Nikkei 225 Index 2014 to 2017
Moses Stock Analysis
AmiBrokerAcademy.com
Disclaimer
The above result is for illustration purpose. It is not meant to be used for buy or sell decision. We do not recommend any particular stocks. If particular stocks of such are mentioned, they are meant as demonstration of Amibroker as a powerful charting software and MACD. Amibroker can program to scan the stocks for buy and sell signals.
These are script generated signals. Not all scan results are shown here. The MACD signal should use with price action. Users must understand what MACD and price action are all about before using them. If necessary you should attend a course to learn more on Technical Analysis (TA) and Moving Average Convergence Divergence, MACD.
Once again, the website does not guarantee any results or investment return based on the information and instruction you have read here. It should be used as learning aids only and if you decide to trade real money, all trading decision should be your own.