April 4, 2014 Singapore Stocks Market, MACD Scan
Moses’s Stocks Corner at amibrokeracademy.com.
Technical Analysis TA
It is important to note that Technical Analysis deals with probabilities and never certainties. TA identifies a trend reversal or continuation at an early stage and ride on it till it is proven correct or wrong at the end of the period. It is like weather. Is it rain when you see dark cloud and hear thunder? No, not yet. Only till rain starts dropping and finally pouring we cannot say its rains. It is common that it is a sunny day after the dark cloud and thunder. We can only start preparing just in case the rain truly comes.
It is only until the price action completed we cannot confirm the trend is up or down. In other words, only until the market is closed for the day then we could announce the status for the market of the day. Only until the price action completed we cannot confirm what technical analysis has projected.
Technical approach toward trading is essentially price action reflects traders being influenced by the economic, politic, market emotions and trader psychology.
Technical Analysis is an act. To indentify a trend or trend reversal at an early stage and ride on it until finally proven correct is more than just science. Fundamentally, no one can predict the market. It is all about probabilities. Trust me.
Indicator
Technical Analysis study has produced many indicators, scientifically derived indicators. Indicator is just like traffic light on the street. It signals to pay attention as a turning is ahead. You may require to stop for the road condition change. Will you have to stop, no; not always. Sometimes, the traffic continue to stay green, but there are time it turns red; and you stop.
So, it is true for indicator. Sometime the signal from indicator is exactly the indicator said, but at time the price action ‘continues’. This is why sometime indicator works and yet more time it would not.
MACD signal is just a projection, at an early stage of where the market is going. This is just like a traffic light. The price action may reversal or it may continue. TA is an act, it is more than a science.
Singapore Stock Market Straits Times s Index
The Singapore Stock Market benchmark, Straits Times Index, STI today closed at 3212.72 points 7.34 points lower than last closed at 3220.06 points.
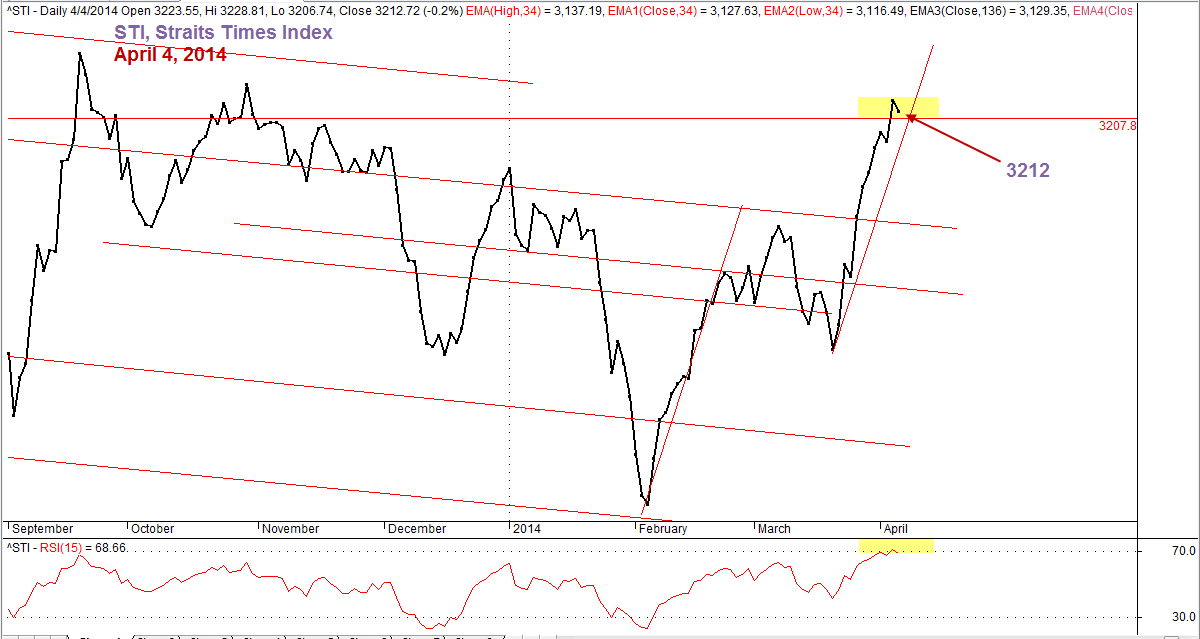
Straits Times Index, STI April 4, 2104 Chart
MACD Scan Results
The following are April 4, 2014 Singapore stocks scan results that have MACD bullish or bearish signal. Total 70 stocks have MACD bullish or bearish signal. Only 34 stocks have volume greater than 500K.
| Ticker | Company | Buy/Sell | Close | Vol.(K) | Screening Result | |
| 1 | A7S | SUNVIC CHEMICAL HOLDINGS LTD | Buy | 0.65 | 28667 | MACD Cross-Up Signal |
| 2 | E5H | GOLDEN AGRI-RESOURCES LTD | Buy | 0.59 | 27403 | MACD Cross-Up Signal |
| 3 | OJ4 | W CORPORATION LIMITED | Buy | 0.058 | 11175 | MACD Cross-Up ZeroLine |
| 4 | T4B | SINO GRANDNESS FOOD IND GP LTD | Buy | 0.745 | 6079 | MACD Cross-Up ZeroLine |
| 5 | 5FL | FALCON ENERGY GROUP LIMITED | Buy | 0.355 | 4232 | MACD Cross-Up ZeroLine |
| 6 | A26 | SINARMAS LAND LIMITED | Buy | 0.61 | 4199 | MACD Cross-Up Signal |
| 7 | GJ8 | DUKANG DISTILLERS HLDGS LTD | Buy | 0.235 | 4025 | MACD Cross-Up Signal |
| 8 | 5DE | EMS ENERGY LIMITED | Buy | 0.062 | 3535 | MACD +ve Divergence |
| 9 | B73 | GLOBAL INVESTMENTS LIMITED | Buy | 0.144 | 2126 | MACD Cross-Up ZeroLine |
| 10 | 544 | CSE GLOBAL LTD | Buy | 0.59 | 2011 | MACD Cross-Up Signal |
| 11 | G05 | GOODPACK LIMITED. | Buy | 2.33 | 1880 | MACD Cross-Up Signal |
| 12 | 5F4 | FIGTREE HOLDINGS LIMITED | Buy | 0.355 | 1089 | MACD Cross-Up Signal |
| 13 | NI3 | UE E&C LTD. | Buy | 1.355 | 911 | MACD Cross-Up Signal |
| 14 | C8R | JIUTIAN CHEMICAL GROUP LIMITED | Buy | 0.069 | 868 | MACD +ve Divergence |
| 15 | 5TN | IEV HOLDINGS LIMITED | Buy | 0.315 | 835 | MACD Cross-Up ZeroLine |
| 16 | L02 | MANHATTAN RESOURCES LIMITED | Buy | 0.7 | 826 | MACD Cross-Up Signal |
| 17 | K11 | KEPPEL TELE & TRAN | Buy | 1.8 | 719 | MACD Cross-Up ZeroLine |
| 18 | S7P | SOILBUILD CONSTRUCTION GRP LTD | Buy | 0.25 | 634 | MACD Cross-Up ZeroLine |
| 19 | B2X | CHINA YUANBANG PROP HLDGS LTD | Buy | 0.188 | 625 | MACD Cross-Up ZeroLine |
| 20 | M1Z | TEE INTERNATIONAL LIMITED | Buy | 0.265 | 617 | MACD-H +ve Divergence |
| 21 | A78 | LIONGOLD CORP LTD | Sell | 0.119 | 23186 | MACD Cross-Down Signal |
| 22 | Z74 | SINGTEL | Sell | 3.65 | 15549 | MACD -ve Divergence |
| 23 | Y92 | THAI BEVERAGE PUBLIC CO LTD | Sell | 0.59 | 11113 | MACD Cross-Down ZeroLine |
| 24 | 5RA | ASIA-PACIFIC STRATEGIC INV LTD | Sell | 0.445 | 6569 | MACD Cross-Down ZeroLine |
| 25 | 558 | UMS HOLDINGS LIMITED | Sell | 0.815 | 2406 | MACD-H -ve Divergence |
| 26 | 5GC | CNA GROUP LTD. | Sell | 0.11 | 2182 | MACD Cross-Down Signal |
| 27 | 5DN | EZRA HOLDINGS LIMITED | Sell | 1.07 | 2127 | MACD Cross-Down Signal |
| 28 | H78 | HONGKONG LAND HOLDINGS LIMITED | Sell | 6.49 | 1851 | MACD-H -ve Divergence |
| 29 | AK3 | SWIBER HOLDINGS LIMITED | Sell | 0.64 | 1665 | MACD Cross-Down ZeroLine |
| 30 | 542 | GIKEN SAKATA (S) LIMITED | Sell | 0.225 | 1480 | MACD Cross-Down Signal |
| 31 | 5UO | SYSMA HOLDINGS LIMITED | Sell | 0.3 | 1231 | MACD Cross-Down ZeroLine |
| 32 | KJ9 | COGENT HOLDINGS LIMITED | Sell | 0.365 | 1071 | MACD-H -ve Divergence |
| 33 | O23 | OSIM INTERNATIONAL LTD | Sell | 2.68 | 732 | MACD-H -ve Divergence |
| 34 | 5WV | ASIAPHOS LIMITED. | Sell | 0.149 | 533 | MACD Cross-Down Signal |
Moses
DISCLAIMER
Information provided here is of the nature of a general comment only and no intend to be specific for trading advice. It has prepared without regard to any particular investment objectives, financial situation or needs. Information should not be considered as an offer or enticement to buy, sell or trade.
You should seek advice from your broker, or licensed investment advisor, before taking any action.
Once again, the website does not guarantee any results or investment return based on the information and instruction you have read here. It should be used as learning aids only and if you decide to trade real money, all trading decision should be your own.
Leave a Reply
You must be logged in to post a comment.