February 2, 2017
Moses Trading Blog Site – AmiBrokerAcademy.com
Thank you for visiting the amibrokeracademy.com blog site. No one like us doing analysis like what you read here. Let your friend know if you enjoy to being here.
Welcome to Moses’s US Stock Analysis @ AmiBrokerAcademy.com.
Apple Inc Stock Chart and MACD Indicator
Remember all setup can fail. If you have been follow the site here, you probably find Apple Inc has been the highly traded stock for the week. You will probably also find that MACD scan signal. Picture worth a thousand words, see chart for details.
Just three days, three MACD signals, 1) MACD -ve Divergence, 2) MACD Cross-down Signal, 3) MACD Cross-up Signal.
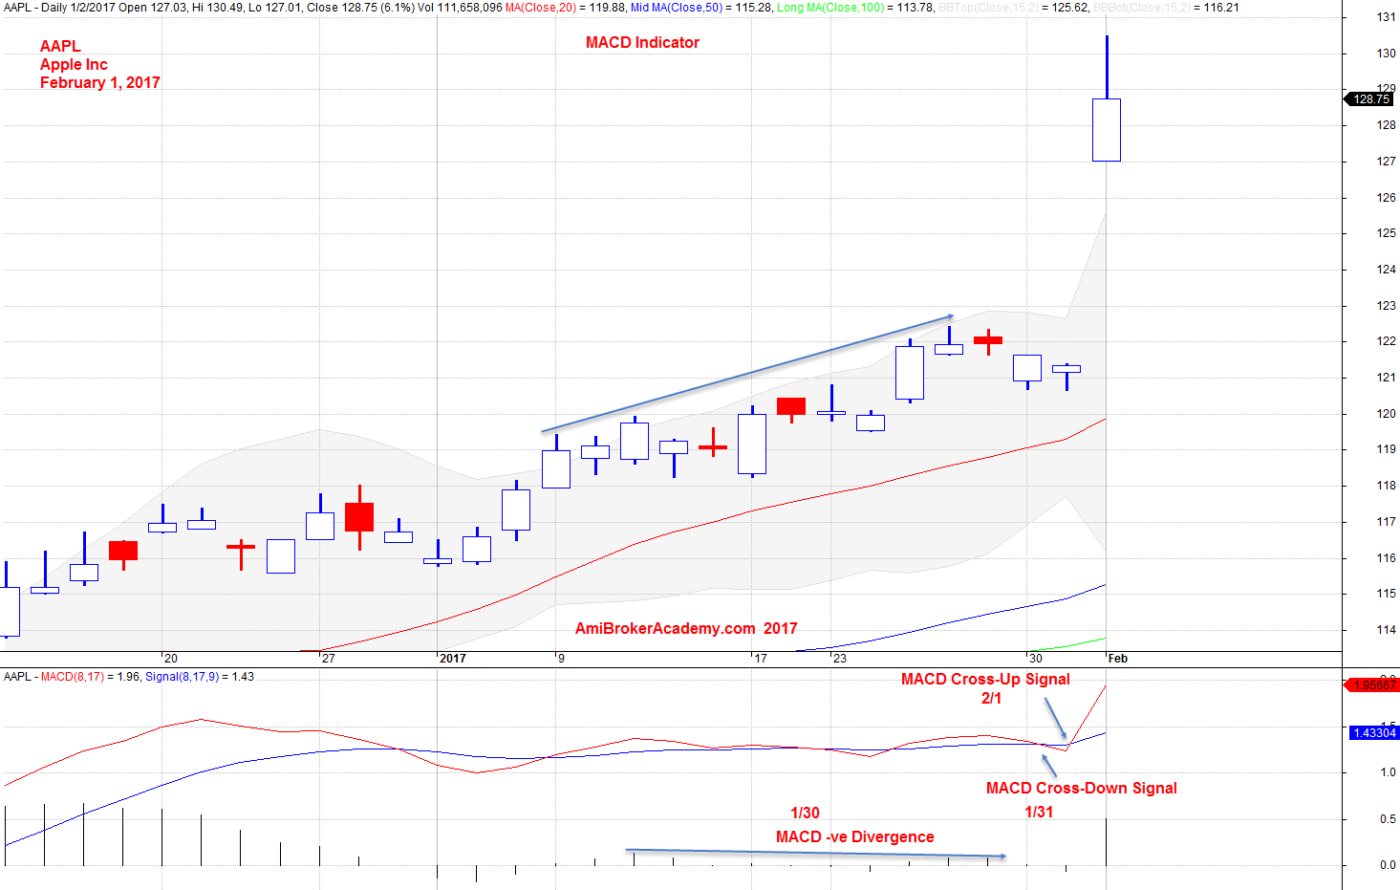
February 1, 2017 Apple Inc and MACD Signals
Moses
AmiBrokerAcademy.com
Disclaimer
The above result is for illustration purpose. It is not meant to be used for buy or sell decision. We do not recommend any particular stocks. If particular stocks of such are mentioned, they are meant as demonstration of Amibroker as a powerful charting software and MACD. Amibroker can program to scan the stocks for buy and sell signals.
These are script generated signals. Not all scan results are shown here. The MACD signal should use with price action. Users must understand what MACD and price action are all about before using them. If necessary you should attend a course to learn more on Technical Analysis (TA) and Moving Average Convergence Divergence, MACD.
Once again, the website does not guarantee any results or investment return based on the information and instruction you have read here. It should be used as learning aids only and if you decide to trade real money, all trading decision should be your own.