Straits Times Index, STI is Singapore stocks market benchmark.It consists of 30 stocks. These stocks are such as SIA, Capitaland, CapitaMall, DBS, StarHub, F&N and so on that represent the Singapore stock market trend.
STI on December 23, 2011 for Singapore stock market
Opened = 2676.99 points
Closed = 2676.47 points
High = 2678.41 points
Low = 2669.25 points
The Straits Times Index, STI closed 2676.47 points, 11.67 points above from the last closed. The bull was trying hard at the holiday eve. But most of the traders are probably already started their yearend holiday.
From the chart, the index was supported at 2600 zone. The pull back has formed and completed a bear trap. Trade what you see and not what you think. This is a bullish signal.
MACD and MACD signal line has met but will wait and confirm the Golden Cross. MACD histogram is narrow and near zero. These are very encouraging for a possible bounce back.
December 23, 2011, Straits Times Index, STI Daily Chart
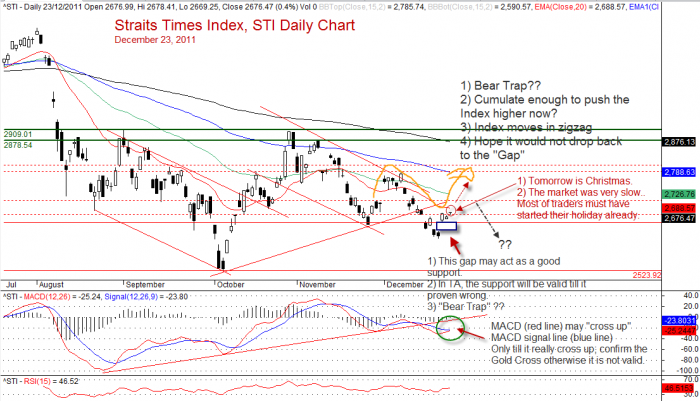
Straits Times Index, STI Daily Chart, December 23, 2011
The above chart is using AmiBroker charting software and data from DataFolio EOD data.
DSICLAIMER
Information provided here is of the nature of a general comment only and no intend to be specific for trading advice. It has prepared without regard to any particular investment objectives, financial situation or needs. Information should not be considered as an offer or enticement to buy, sell or trade.
You should seek advice from your broker, or licensed investment advisor, before taking any action.
Once again, the website does not guarantee any results or investment return based on the information and instruction you have read here. It should be used as learning aids only and if you decide to trade real money, all trading decision should be your own.
Leave a Reply
You must be logged in to post a comment.