January 26, 2018
Top Pharma List
Stock Analysis
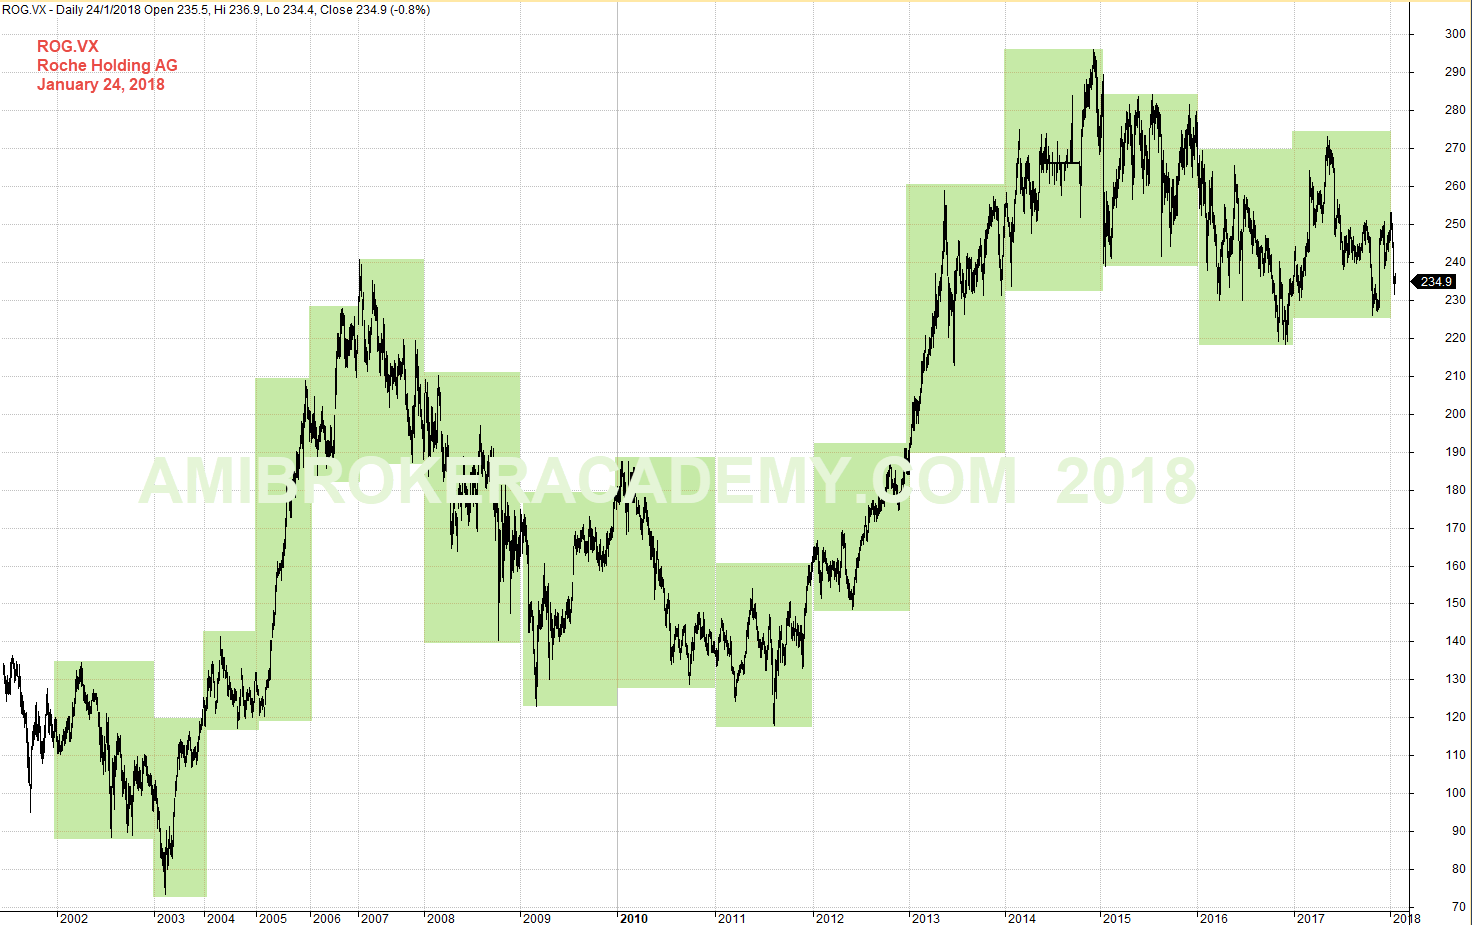
ROG.VX Roche Holding AG Year High Low From 2002
There is a vivid ABCD pattern, hope you could see it. The AB leg starts from 2003 and ends 2007, the pullback, BC leg starts from 2007 and ends 2011, the CD leg starts from 2011 and ends at 2014. Can you see it now?
Roche stock test the high of 240, and the next high is near 300. Hope you can see the current level was the historical resistance at 240. The resistance turns support, can the support hold the fall of the price.
Picture worth a thousand words. Think, think think (think more) and got more things. Have fun!
Manage your risk.
Powerful Chart Software – AmiBroker
The following chart is produced using AmiBroker charting software. It is a powerful chart software. You plot the stocks you are interested all in one chart, as long as you still could read them. See chart below.
January 24, 2018 Roche Holding AG Year High Low from 2002
ROG.VX Roche Holding AG and MA Band and ABCD Patterns
See chart, MA band slopping up, slopping down, the price action bouncing above MA band, the price action close down below MA band, price action resisted by the MA band, and so on. MA is a great visual tool for bullish or bearish trend.
Next, just 2017 alone, you could identify many ABCD pattern, if you can just trade AB = CD pattern, you could laughing to the bank. Of course, this is easy said then done. You must carry with you many trader quality to trade the AB = CD pattern.
Have fun!

January 24, 2018 Roche Holding AG and MA Band and ABCD Patterns
ROG.VX Roche Holding AG and MACD
See chart, after MACD divergence the trend end, now we see another MACD divergence, will the trend move further now. Will see.
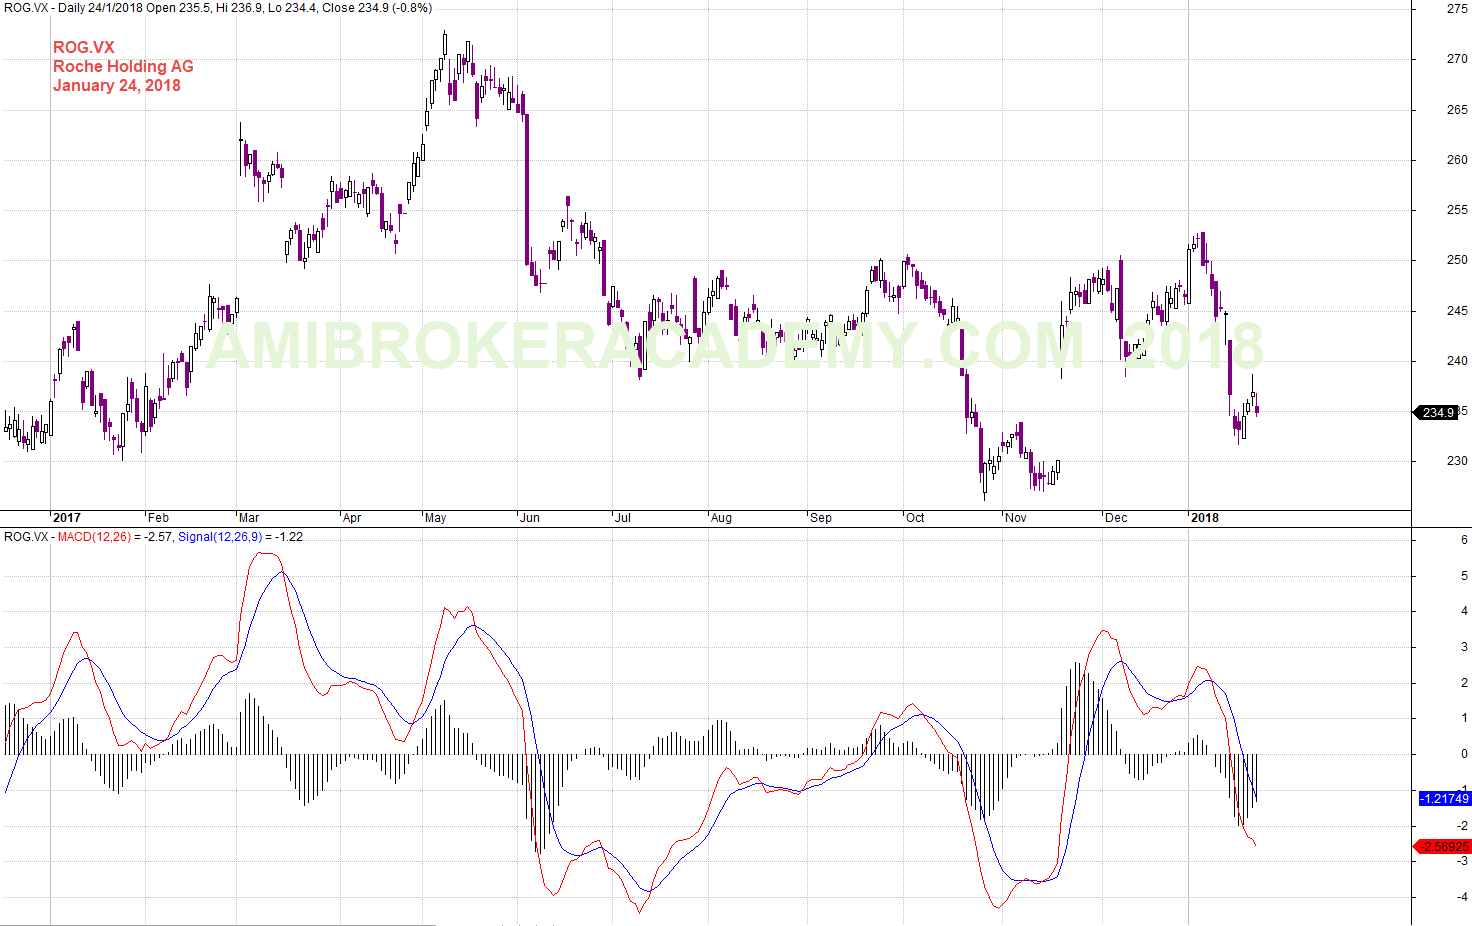
January 24, 2018 Roche Holding AG and MACD
Moses
AmiBrokerAcademy.com
Disclaimer
The above result is for illustration purpose. It is not meant to be used for buy or sell decision. We do not recommend any particular stocks. If particular stocks of such are mentioned, they are meant as demonstration of Amibroker as a powerful charting software and MACD. Amibroker can program to scan the stocks for buy and sell signals.
These are script generated signals. Not all scan results are shown here. The MACD signal should use with price action. Users must understand what MACD and price action are all about before using them. If necessary you should attend a course to learn more on Technical Analysis (TA) and Moving Average Convergence Divergence, MACD.
Once again, the website does not guarantee any results or investment return based on the information and instruction you have read here. It should be used as learning aids only and if you decide to trade real money, all trading decision should be your own.