December 4, 2017
Singapore Stock Analysis
BQO Delong Holdings and Support Resistance
The stock price goes from 40 cents to four dollars in less than a year. See stock chart for more.
Powerful Chart Software – AmiBroker
The following chart is produced using AmiBroker charting software. It is a powerful chart software. You can easily add the channel. See chart.
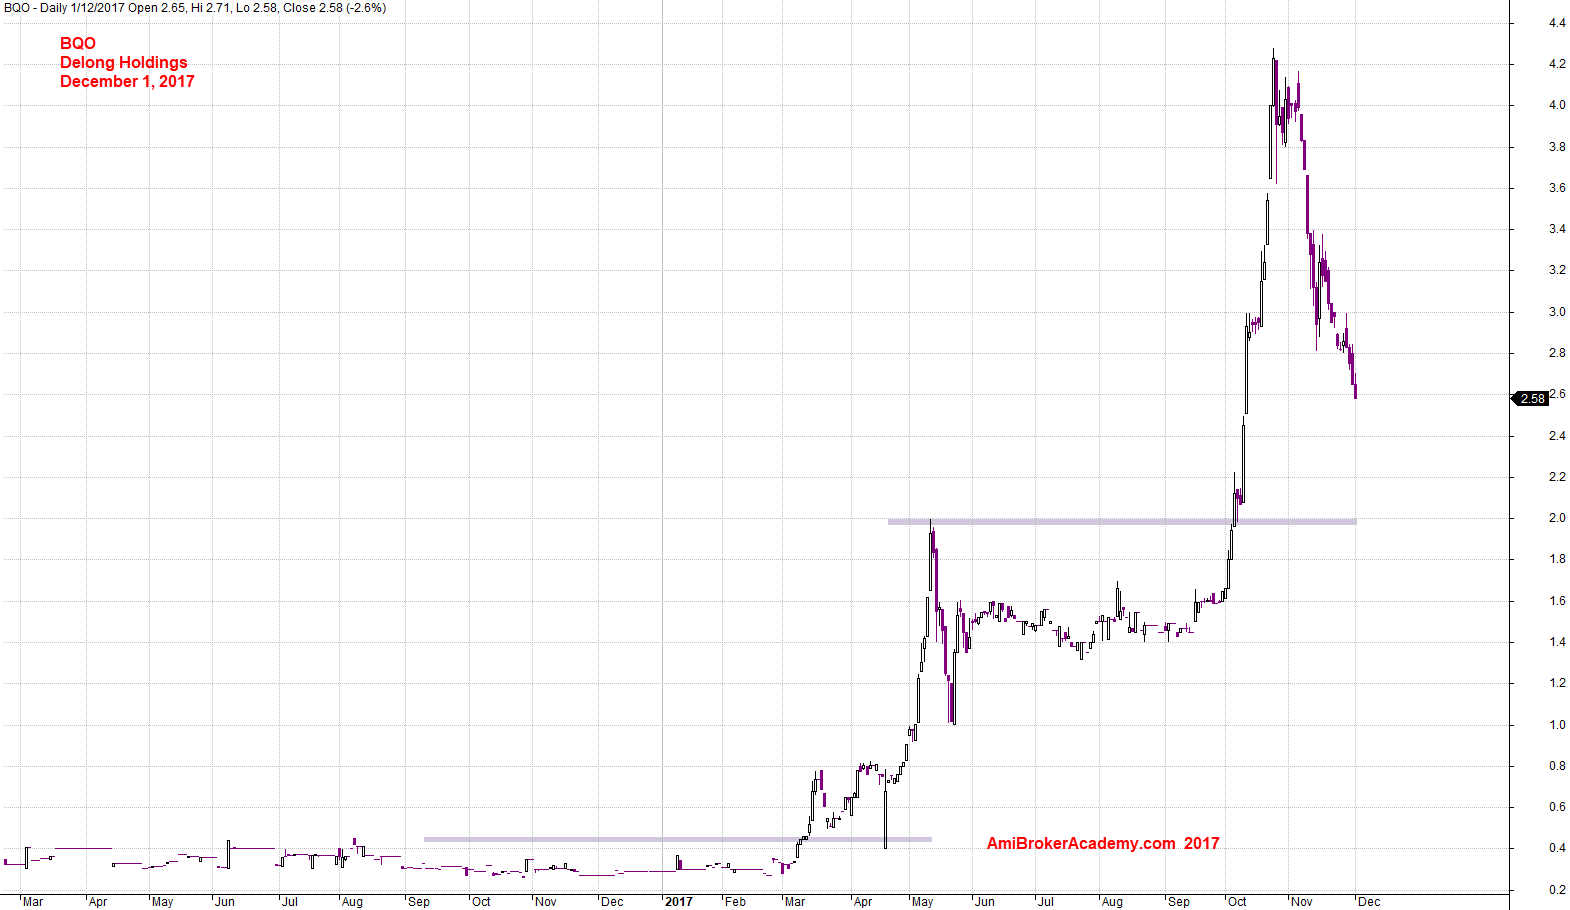
December 1, 2017 Delong Holdings and Support Resistance
BQO Delong Holdings and MACD Signals
See chart, MACD signal moves from near zeroline to above. The stock price bounce, and bounce so high.
The chart is using the powerful Amibroker charting software.
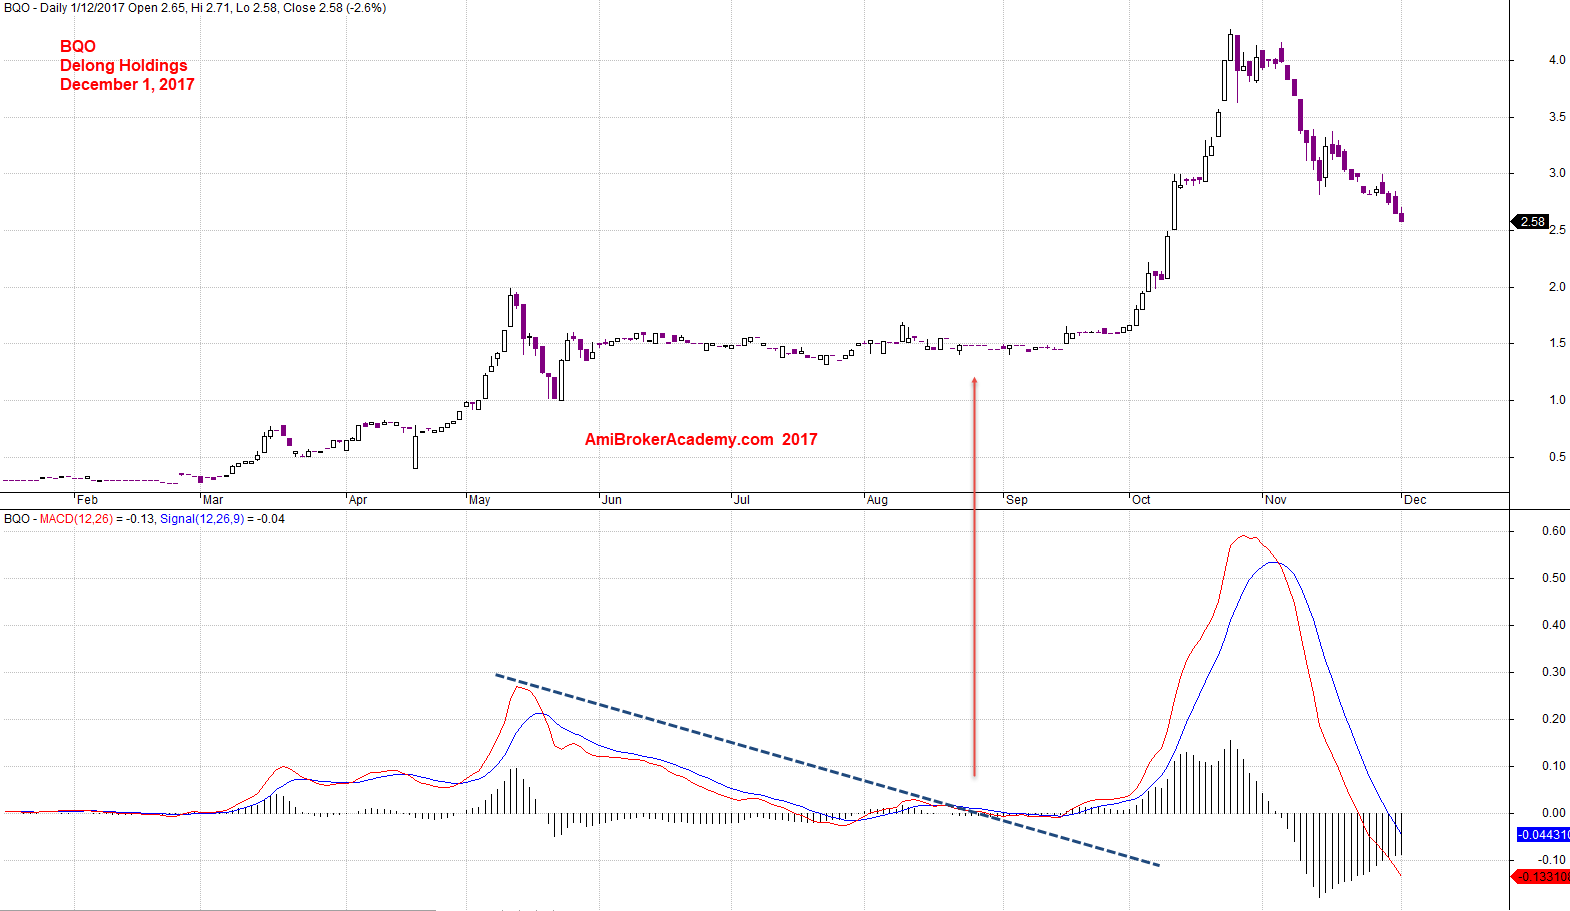
December 1, 2017 Delong Holdings and MACD Signals
BQO Delong Holdings and Channel
See chart on the channel and price action.
The chart is using the powerful Amibroker charting software.
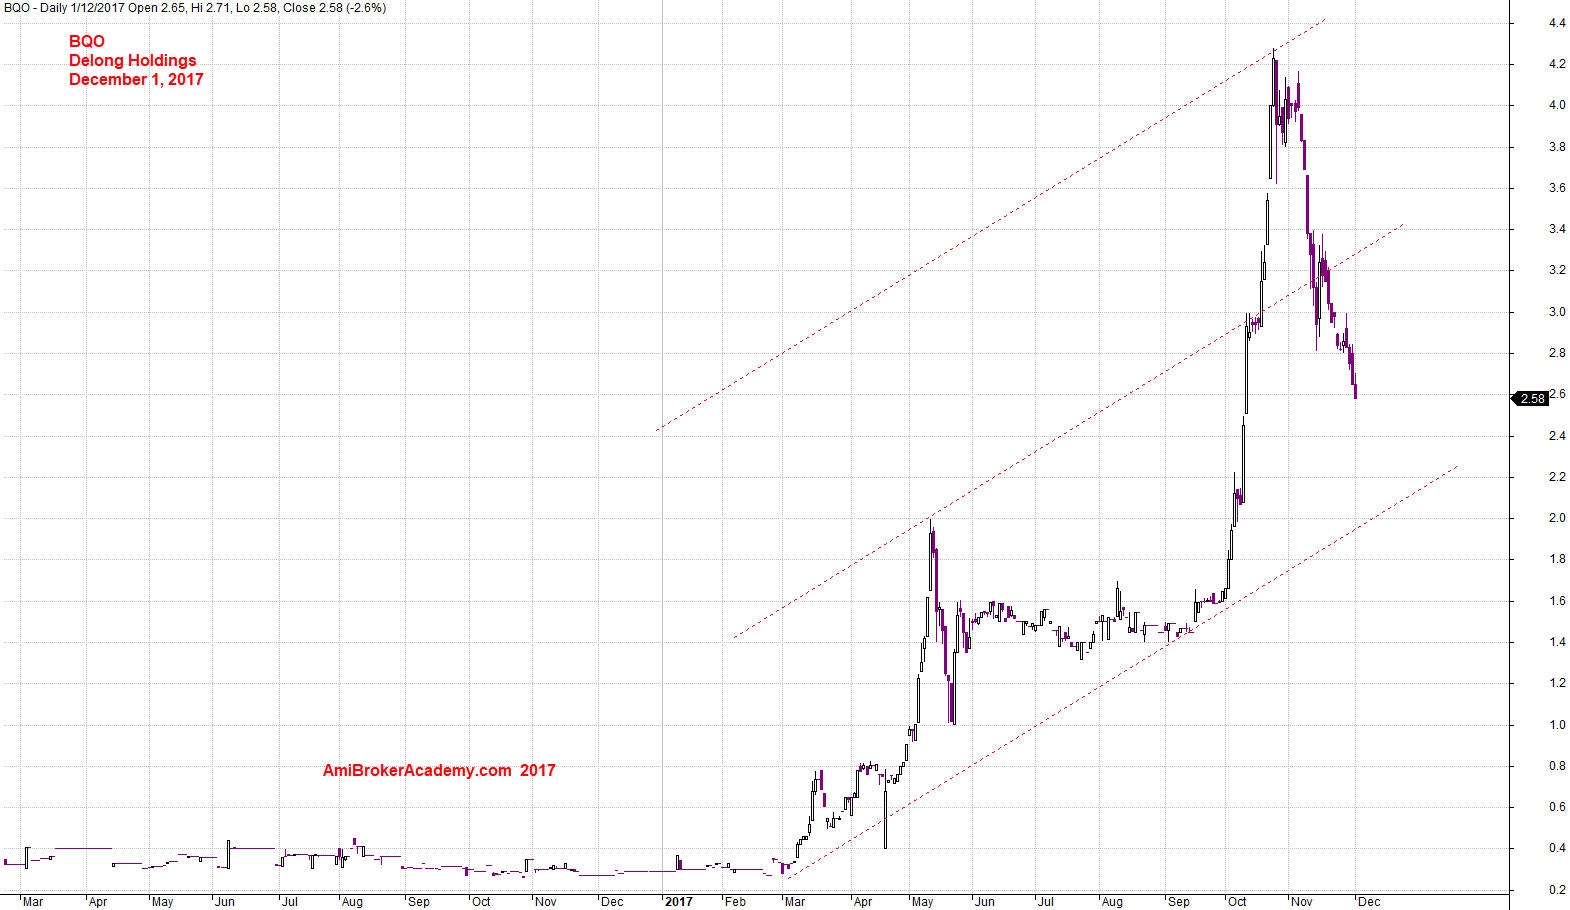
December 1, 2017 Delong Holdings and Channel
Moses
AmiBrokerAcademy.com
Disclaimer
The above result is for illustration purpose. It is not meant to be used for buy or sell decision. We do not recommend any particular stocks. If particular stocks of such are mentioned, they are meant as demonstration of Amibroker as a powerful charting software and MACD. Amibroker can program to scan the stocks for buy and sell signals.
These are script generated signals. Not all scan results are shown here. The MACD signal should use with price action. Users must understand what MACD and price action are all about before using them. If necessary you should attend a course to learn more on Technical Analysis (TA) and Moving Average Convergence Divergence, MACD.
Once again, the website does not guarantee any results or investment return based on the information and instruction you have read here. It should be used as learning aids only and if you decide to trade real money, all trading decision should be your own.