August 1, 2017
Alibaba Group Holding and 34 Moving Average Band and Support Resistance
See chart for more, picture worth a thousand words.
We see price action cross down, cross up 20 MA, and price action supported by 20 MA. The share price stay above 20 MA in 2017 till now.
Price action breakout the 2016 high, see chart.
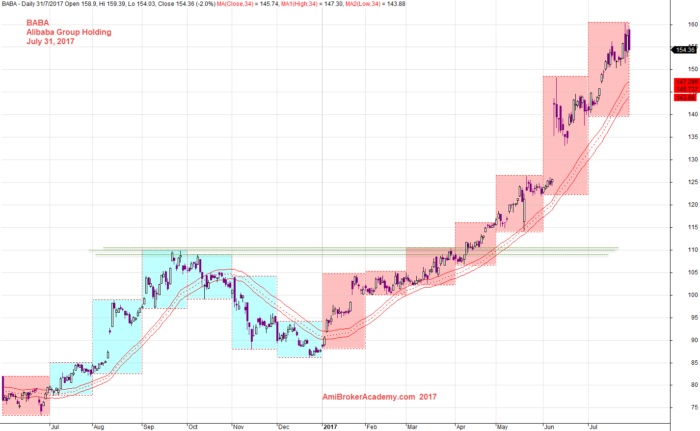
July 31, 2017 Alibaba Group Holding and 34 MA Band and Support Resistance
BABA and Channels
Channel slopping up and slopping up further, very bullish.
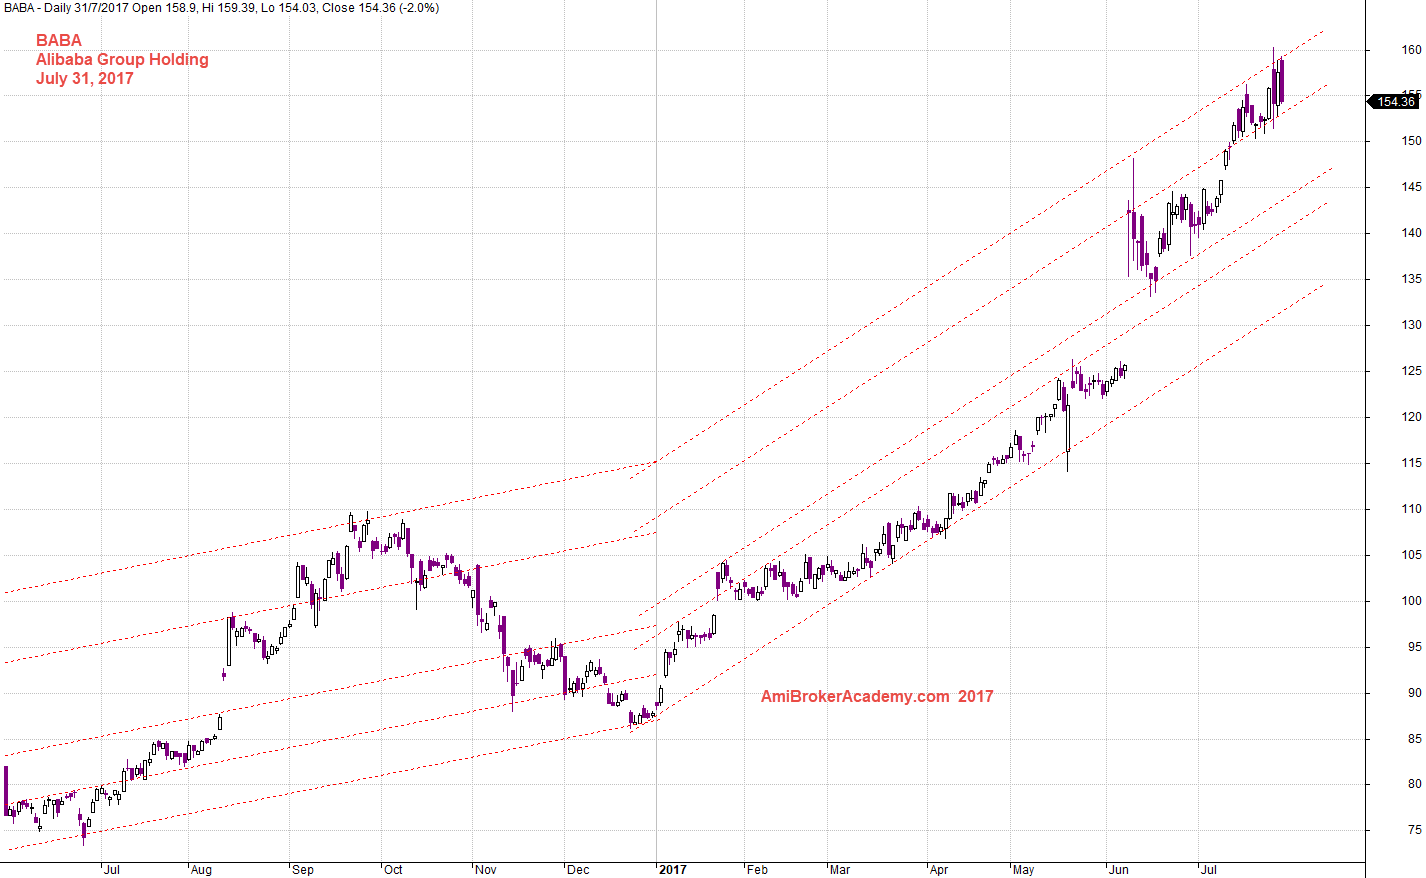
July 31, 2017 Alibaba Group Holding and Channels
Alibaba Group Holding and MACD Signals
MACD crosses above zeroline and stay above zeroline. Bullish.
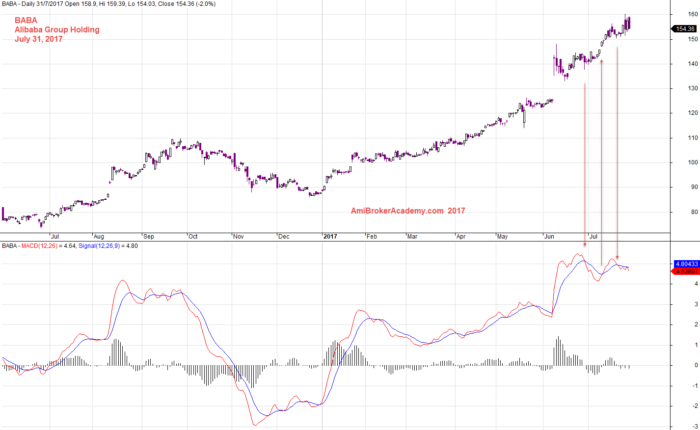
July 31, 2017 Alibaba Group Holding and MACD Indicator
So, what’s the trade strategy?
Wait for pullback before buy. Otherwise, you will have to buy high and sell higher.
Moses
AmiBrokerAcademy.com
Disclaimer
The above result is for illustration purpose. It is not meant to be used for buy or sell decision. We do not recommend any particular stocks. If particular stocks of such are mentioned, they are meant as demonstration of Amibroker as a powerful charting software and MACD. Amibroker can program to scan the stocks for buy and sell signals.
These are script generated signals. Not all scan results are shown here. The MACD signal should use with price action. Users must understand what MACD and price action are all about before using them. If necessary you should attend a course to learn more on Technical Analysis (TA) and Moving Average Convergence Divergence, MACD.
Once again, the website does not guarantee any results or investment return based on the information and instruction you have read here. It should be used as learning aids only and if you decide to trade real money, all trading decision should be your own.