November 7, 2016
2016 is a Great Year
There were many things happen this year, just in Financial world, Brexit and the coming US Presidential Election.
Let’s have a look at Singapore stock market. We will study the chart from December 1992 to present, and 2015 till now. It is important to keep the historical chart handy.
^STI | The Straits Times Index Monthly Chart From December 1992
You can see resistance turn support. Can the index move higher than 2800 points level? Will see.
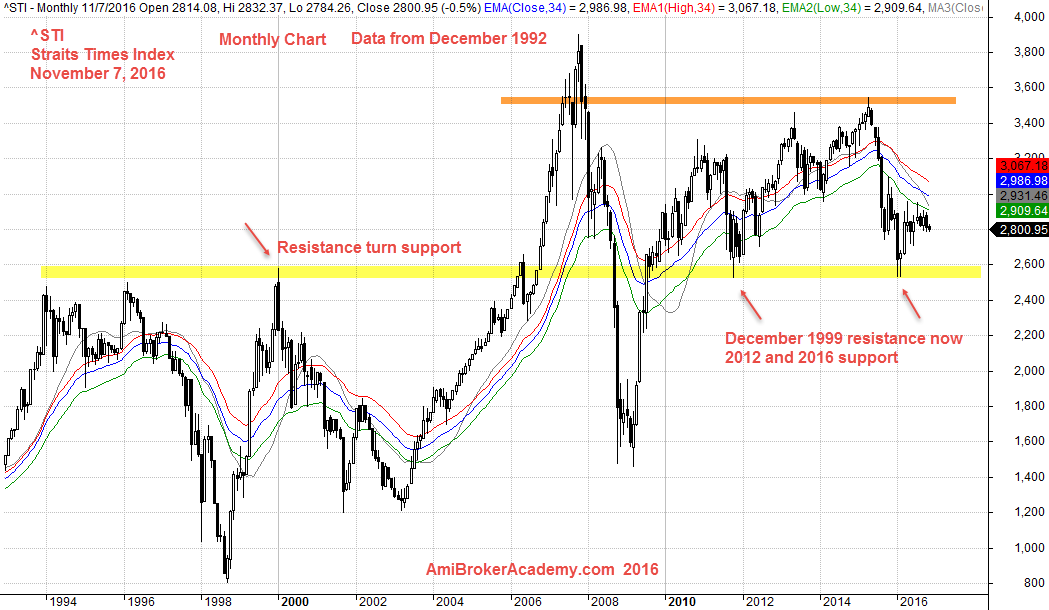
November 7, 2016 Singapore Stock Benchmark, The Straits Times Index from December 1992 Monthly Chart
^STI | The Straits Times Index Daily from 2015
See the fall from the peak in 2015 at 3549 points down to 2016 peak at 2964 points. Now the market is struggle near 2800 points. Look out for more ABCD Chart patterns.
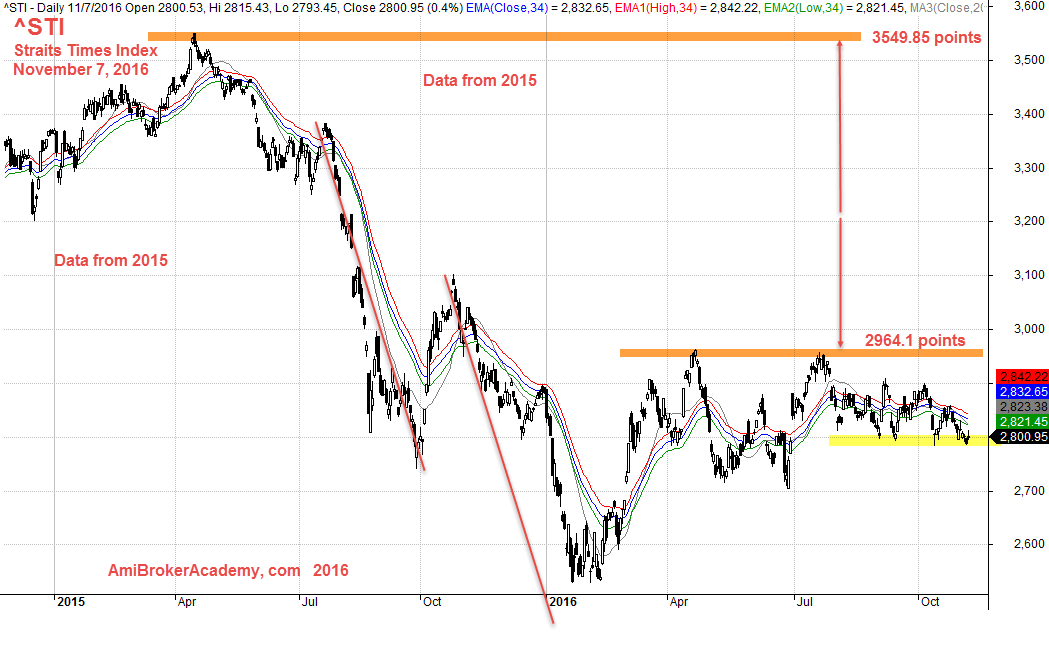
November 7, 2016 The Straits Times Index Daily
Moses Singapore Stock Desk
AmiBrokerAcademy.com
Disclaimer:
The discussion here is for educational purposes only. All information, data, symbols and trading ideas discussed hereby are the author or authors intend to demonstrate or illustrate purposes only. These are not recommendations or advice. It is not to be construed or intended as providing trading or legal advice.
Besides that this discussion is not an offer or solicitation of any kind in any jurisdiction where any AmiBrokerAcademy.com or its affiliate is try to do business.
Please note that active trading is not suitable for everyone. Any decisions you make about your trading or investment are important to you and your family, therefore should be made in consultation with a competent financial advisor or professional. We are not financial advisor and do not claim to be one.
Any views expressed here-in are not necessarily those held by amibrokeracademy.com.