18 April, 2017
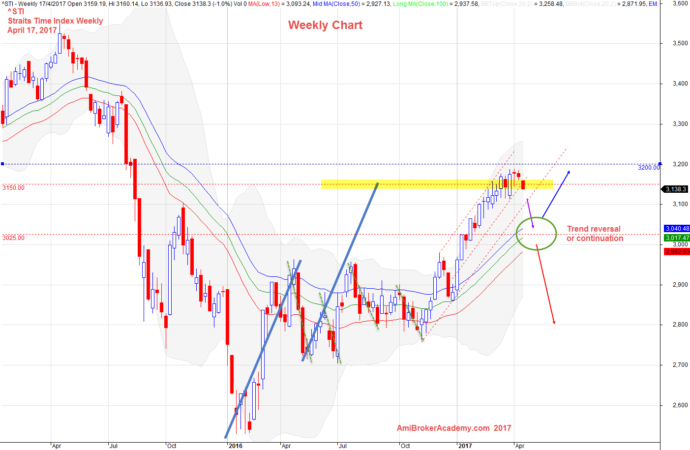
^STI Straits Time Index Weekly Chart
ST Index has declined since 2015 April, and reach the bottom in end December 2016. STI has since retrace up. crossed the 34 EMA wave and got supported by the slopping up wave.
Can the momentum remain? ST Index may pullback to get supported by the wave again before further north. But it is also likely the index fail and get below the wave. So watchout.
April 17, 2017 Straits Times Index Weekly Chart
Moses Stock Analysis
AmiBrokerAcademy.com
Disclaimer
The above result is for illustration purpose. It is not meant to be used for buy or sell decision. We do not recommend any particular stocks. If particular stocks of such are mentioned, they are meant as demonstration of Amibroker as a powerful charting software and MACD. Amibroker can program to scan the stocks for buy and sell signals.
These are script generated signals. Not all scan results are shown here. The MACD signal should use with price action. Users must understand what MACD and price action are all about before using them. If necessary you should attend a course to learn more on Technical Analysis (TA) and Moving Average Convergence Divergence, MACD.
Once again, the website does not guarantee any results or investment return based on the information and instruction you have read here. It should be used as learning aids only and if you decide to trade real money, all trading decision should be your own.