BE CAREFUL OF WHAT YOU READ
You need real, updated information that actually works!
And the really sad truth is…
MOST CONFUSE THEORY WITH FACT
PICTURE WORTH A THOUSAND WORDS, SEE CHART FOR MORE
Straits Times Index Weekly Chart
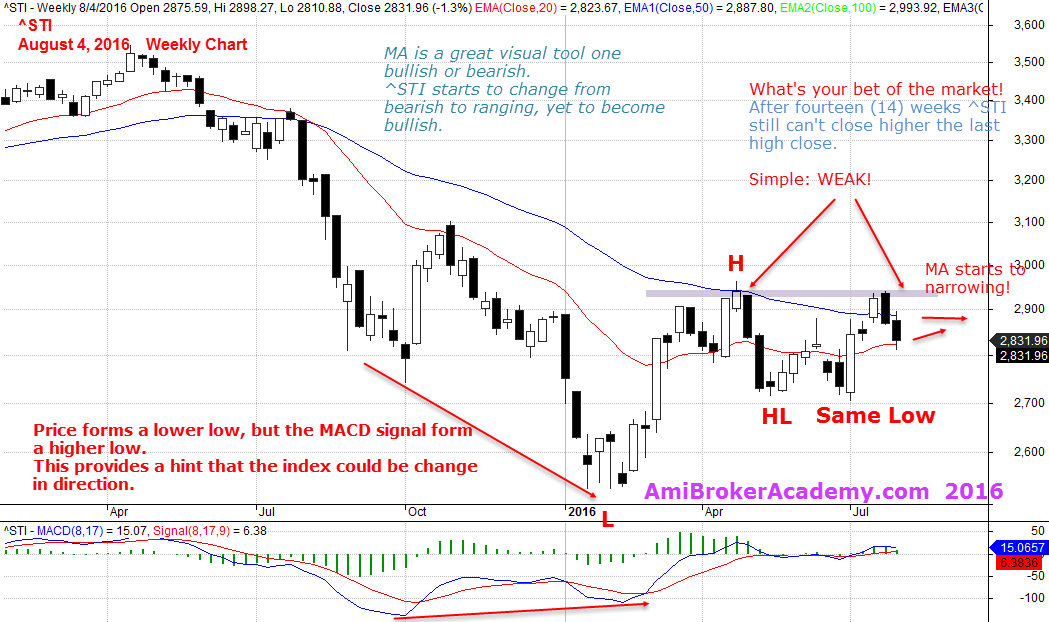
August 4, 2016 Straits Times Index Weekly Chart with MACD
Moses Stock Analysis and Scan
AmiBrokerAcademy.com
Disclaimer: All information, data and material contained, presented, or provided on amibrokeracademy.com is for educational purposes only. It is not to be construed or intended as providing trading or legal advice. Decisions you make about your trading or investment are important to you and your family, therefore should be made in consultation with a competent financial advisor or professional. We are not financial advisor and do not claim to be. Any views expressed here-in are not necessarily those held by amibrokeracademy.com. You are responsible for your trade decision and wealth being.