March 9, 2017
Moses Stock Trading Blog Site – AmiBrokerAcademy.com
Thank you for visiting the amibrokeracademy.com blog site. No one doing analysis like what you read here.
Welcome to Moses’s US Stock Analysis @ AmiBrokerAcademy.com.
We did an analysis for Dow, we posted a closeup view. See chart for more.
Let study the S&P 500.
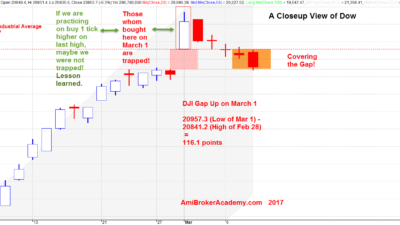
March 8, 2017 Dow Jones Industrial Average CloseupView
^GSPC S&P 500 Closeup View
We see S&P 500 gap, gap up on March 1, just like Dow on the same day. The market must be feeling the price was too low on the previous trading day. Wow! What a great thought for all.
We could see the number of traders get trapped after the gap up; suddenly all feel that is wrong. On the next trading day, bull start taking profit and many bear join in to sell. Now the gap are cover for S&P 500. Any for Dow, will see.
Watch, if the bear cross the level we draw on the chart, the market is starting to go bearish. Reversal for big, a pullback for a short-term may be.
Trade what you see.
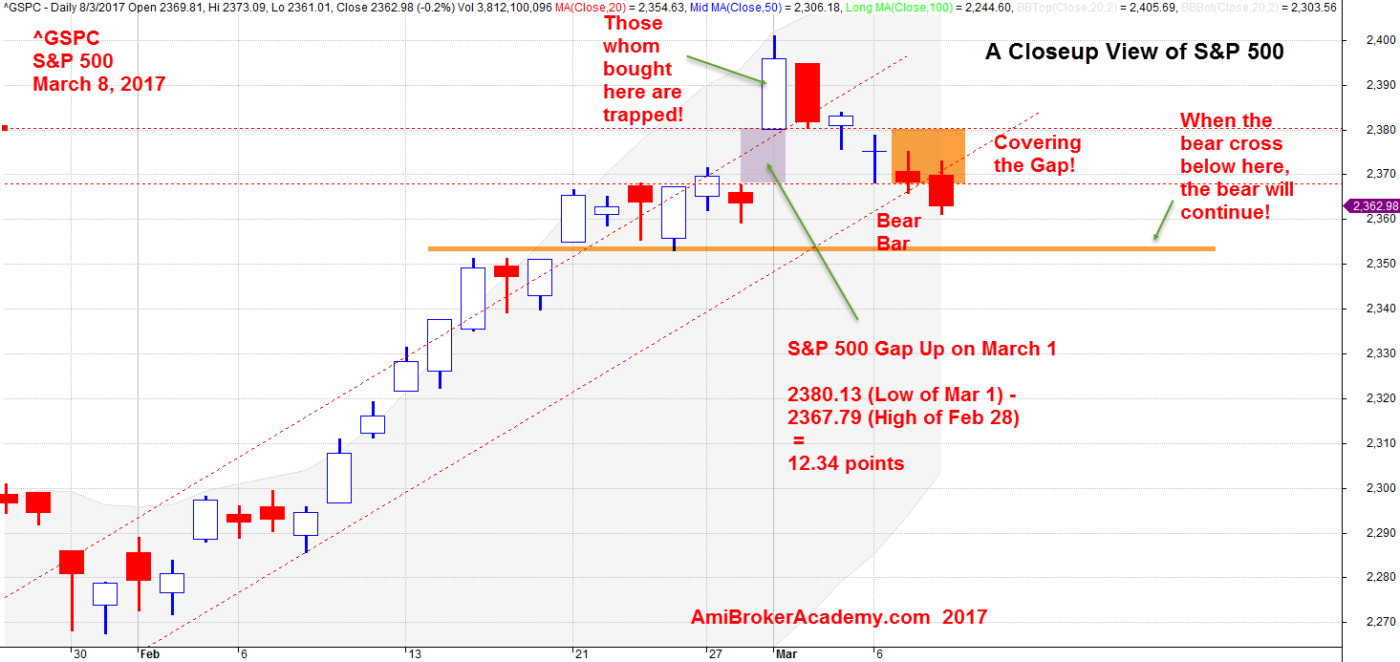
March 8, 2017 S&P 500 Closeup View
To have the index gap is not easy. But these days it is like a common feature. See Dow gaps for more.
Remember, we are only sharing the experience and for the education purpose. We do not provide buy or sell signal, please seek your trade adviser for their expert advice. Besides that you are responsible for your own action. Trading is personal, even you can enter the trade at the exact same manner, you may not make money.
Remember too, trading is not a get rich fast business like many have advertise. It needs a lot of hard work and good money and risk management.
Have fun! Happy learning.
Moses US Stock Analysis
AmiBrokerAcademy.com
Disclaimer
The above result is for illustration purpose. It is not meant to be used for buy or sell decision. We do not recommend any particular stocks. If particular stocks of such are mentioned, they are meant as demonstration of Amibroker as a powerful charting software and MACD. Amibroker can program to scan the stocks for buy and sell signals.
These are script generated signals. Not all scan results are shown here. The MACD signal should use with price action. Users must understand what MACD and price action are all about before using them. If necessary you should attend a course to learn more on Technical Analysis (TA) and Moving Average Convergence Divergence, MACD.
Once again, the website does not guarantee any results or investment return based on the information and instruction you have read here. It should be used as learning aids only and if you decide to trade real money, all trading decision should be your own.