Today, Straits Times Index, STI gap down at the stocks market opened at 2630.60 points and ended the day at 2618.09 points. It is 41.13 points lower than the last Friday closed. Is this a bear trap? Will See.
See the STI daily and weekly chart for visual analysis.
Singapore stock market scan helps to filter stocks listed in Singapore Stock Exchange to identify stocks potentially have MACD bullish or bearish signal.
MACD Scan for Singapore stock market has picked 8 stocks on December 19, 2011 after the market closed. These stocks pass the scanning criteria for volume exceeding 100K and price closed above $1. Out of 8 stocks picked 1 stock have bullish signal, and the rest of 7 stocks have bearish signal.
Straits Times Index, STI, Singapore stocks market benchmark index for December 19, 2011
The STI closed 41.13 points lower.
O = 2630.60 points
C = 2618.09 points
H = 2631.17 points
L = 2611.23 points
The following are the 8 Stocks Picked by MACD Scanner for market closed December 19, 2011
| Company | Type | Close | Vol.(K) | Screening Result |
| NOBLE GROUP LIMITED | bearish |
1.105 |
25325 |
MACD Cross-Down Signal |
| NEPTUNE ORIENT LINES LIMITED | bearish |
1.105 |
6188 |
MACD Cross-Down Signal |
| UNITED OVERSEAS BANK LTD | bearish |
15.1 |
3311 |
MACD Cross-Down Signal |
| COMFORTDELGRO CORPORATION LTD | bearish |
1.385 |
2548 |
MACD Cross-Down ZeroLine |
| MAPLETREE INDUSTRIAL TRUST | bearish |
1.07 |
2408 |
MACD Cross-Down Signal |
| SINGAPORE TECH ENGINEERING LTD | bullish |
2.7 |
2205 |
MACD +ve Divergence |
| SMRT CORPORATION LTD | bearish |
1.775 |
1274 |
MACD Cross-Down ZeroLine |
| FORTUNE REAL ESTATE INV TRUST | bearish |
3.64 |
253 |
MACD -ve Divergence |
Straits Times Index, STI Daily Chart
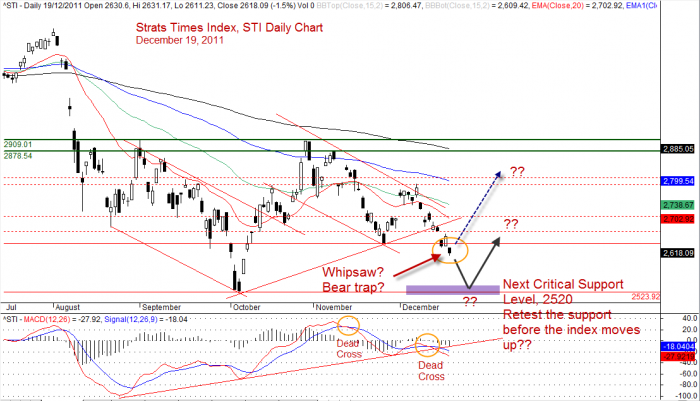
Straits Times Index, STI Daily Chart, December 19, 2011
Straits Times Index, STI Weekly Chart
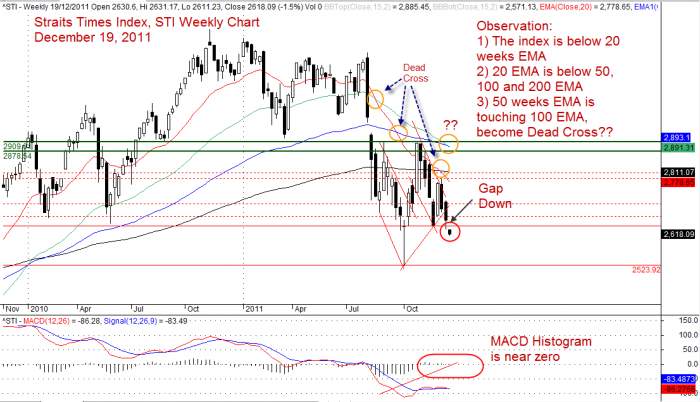
Straits Times Index, STI Weekly Chart, December 19, 2011
DSICLAIMER
Information provided here is of the nature of a general comment only and no intend to be specific for trading advice. It has prepared without regard to any particular investment objectives, financial situation or needs. Information should not be considered as an offer or enticement to buy, sell or trade.
The above result is for illustration purpose If particular stocks of such are mentioned, they are meant as demonstration of Amibroker as a powerful charting software and MACD characteristics. Amibroker can program to scan the stocks for buy and sell signals.
The MACD signal should use with price action. Users must understand MACD and price action before using them. If necessary you should attend a course to learn more on Technical Analysis (TA) and Moving Average Convergence Divergence (MACD).
You should seek advice from your broker, or licensed investment advisor, before taking any action.
Once again, the website does not guarantee any results or investment return based on the information and instruction you have read here. It should be used as learning aids only and if you decide to trade real money, all trading decision should be your own.
Leave a Reply
You must be logged in to post a comment.