February 7, 2017
Welcome to Moses’s Singapore Stock Analysis @ AmiBrokerAcademy.com.
J69U Frasers Centrepoint Trust Stock Chart and MACD Indicator
Reversal. The price is being supported for three months, August, September, October and finally breakout, the price break below the support.
The trend end, MACD signal the trend end too.
We see the price breakout from resistance, the price stay above, resistance turns support.
Picture worth a thousand words. Hop you can easily identify all of the above narrative.
So watch out, the previous support can stop the trend to go further north. Trade what you see lah.
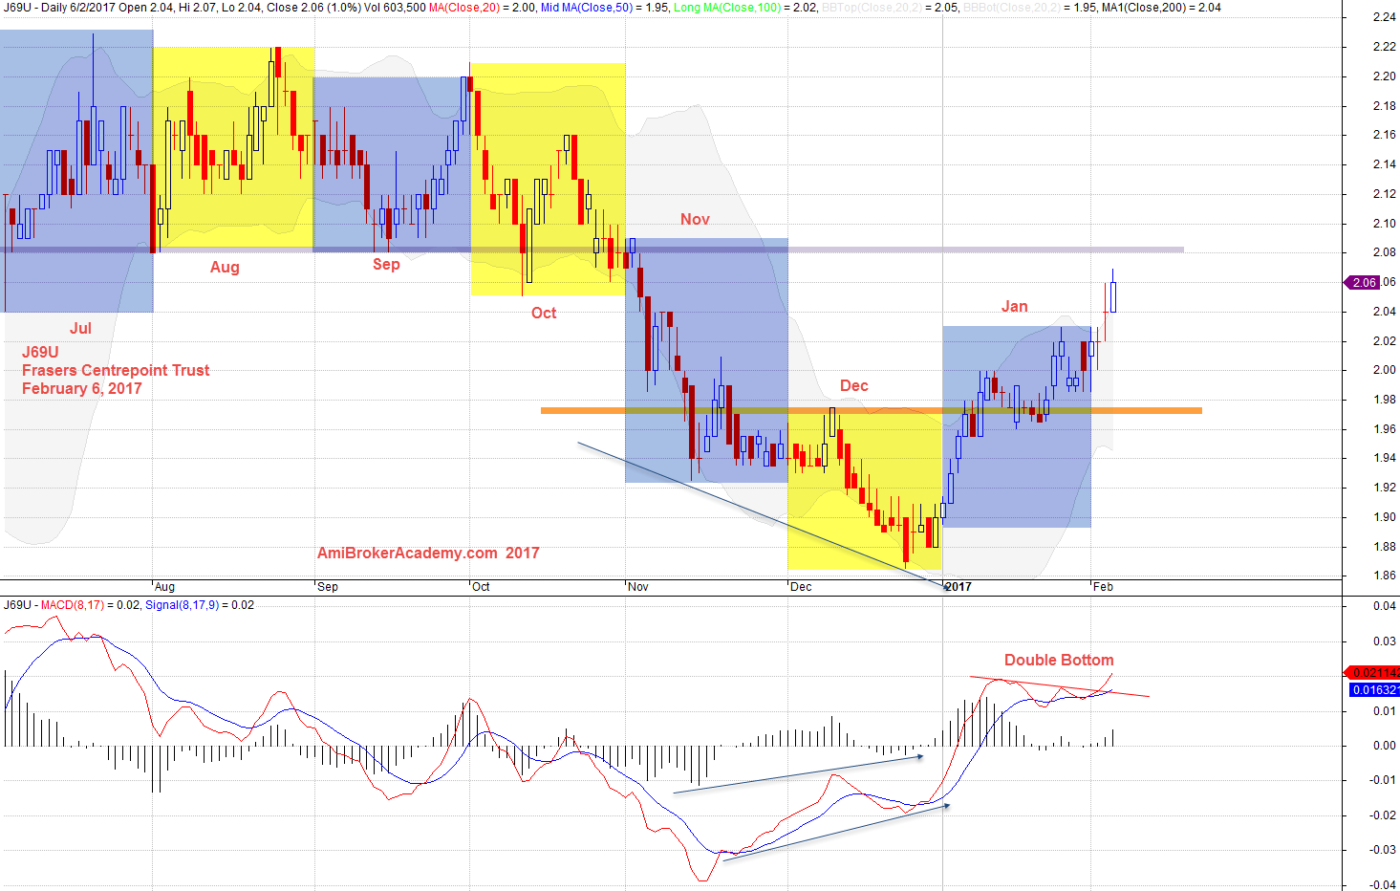
February 6, 2017 Frasers Centrepoint Trust and MACD Indicator
Moses
AmiBrokerAcademy.com
Disclaimer
The above result is for illustration purpose. It is not meant to be used for buy or sell decision. We do not recommend any particular stocks. If particular stocks of such are mentioned, they are meant as demonstration of Amibroker as a powerful charting software and MACD. Amibroker can program to scan the stocks for buy and sell signals.
These are script generated signals. Not all scan results are shown here. The MACD signal should use with price action. Users must understand what MACD and price action are all about before using them. If necessary you should attend a course to learn more on Technical Analysis (TA) and Moving Average Convergence Divergence, MACD.
Once again, the website does not guarantee any results or investment return based on the information and instruction you have read here. It should be used as learning aids only and if you decide to trade real money, all trading decision should be your own.