February 6, 2017
Welcome to Moses’s Singapore Stock Analysis @ AmiBrokerAcademy.com.
H17 HI-P International Stock Chart
It is uptrend. Every month the price just keep forming higher high until 2017. Those whom jump in the last month of 2016, all got trapped. Wow, what a trading? If you have draw the high low for every month, you will probably be alerted by the increase of price change has reduced month by month. The buyers have lost interest in this stock; the price can not push as high as the start list July 2016.
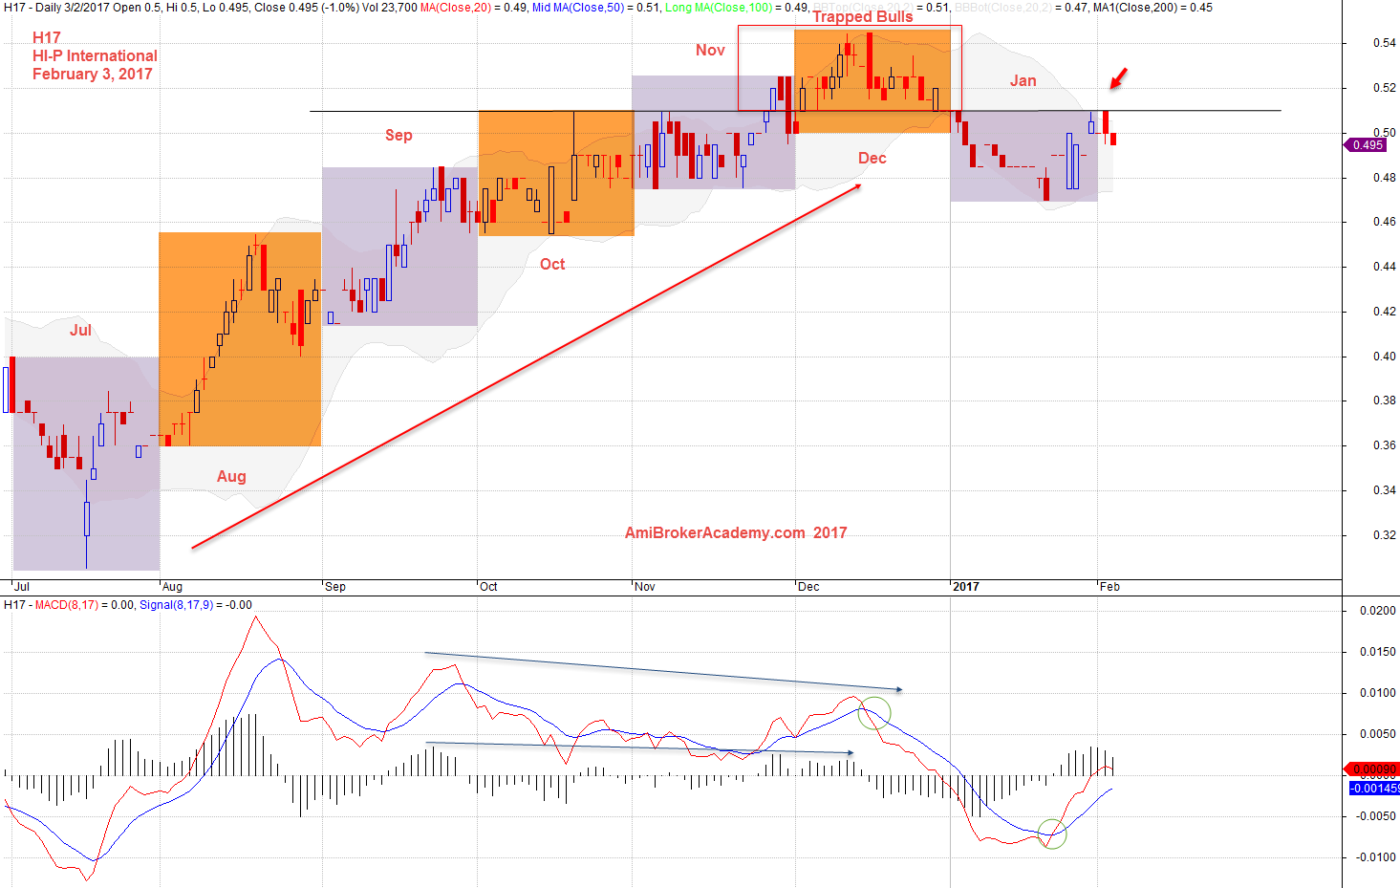
February 3, 2017 HI-P International and MACD Indicator
Moses
AmiBrokerAcademy.com
Disclaimer
The above result is for illustration purpose. It is not meant to be used for buy or sell decision. We do not recommend any particular stocks. If particular stocks of such are mentioned, they are meant as demonstration of Amibroker as a powerful charting software and MACD. Amibroker can program to scan the stocks for buy and sell signals.
These are script generated signals. Not all scan results are shown here. The MACD signal should use with price action. Users must understand what MACD and price action are all about before using them. If necessary you should attend a course to learn more on Technical Analysis (TA) and Moving Average Convergence Divergence, MACD.
Once again, the website does not guarantee any results or investment return based on the information and instruction you have read here. It should be used as learning aids only and if you decide to trade real money, all trading decision should be your own.