February 19, 2017
Welcome to Moses’s Singapore Stock Analysis @ AmiBrokerAcademy.com.
5ME Ezion Holdings Charting, Support and Resistance and 34 EMA Wave
The stock price close below 34 EMA wave and get resisted by wave. The wave direction is point below three o’clock direction. Begin the journey to travel south.
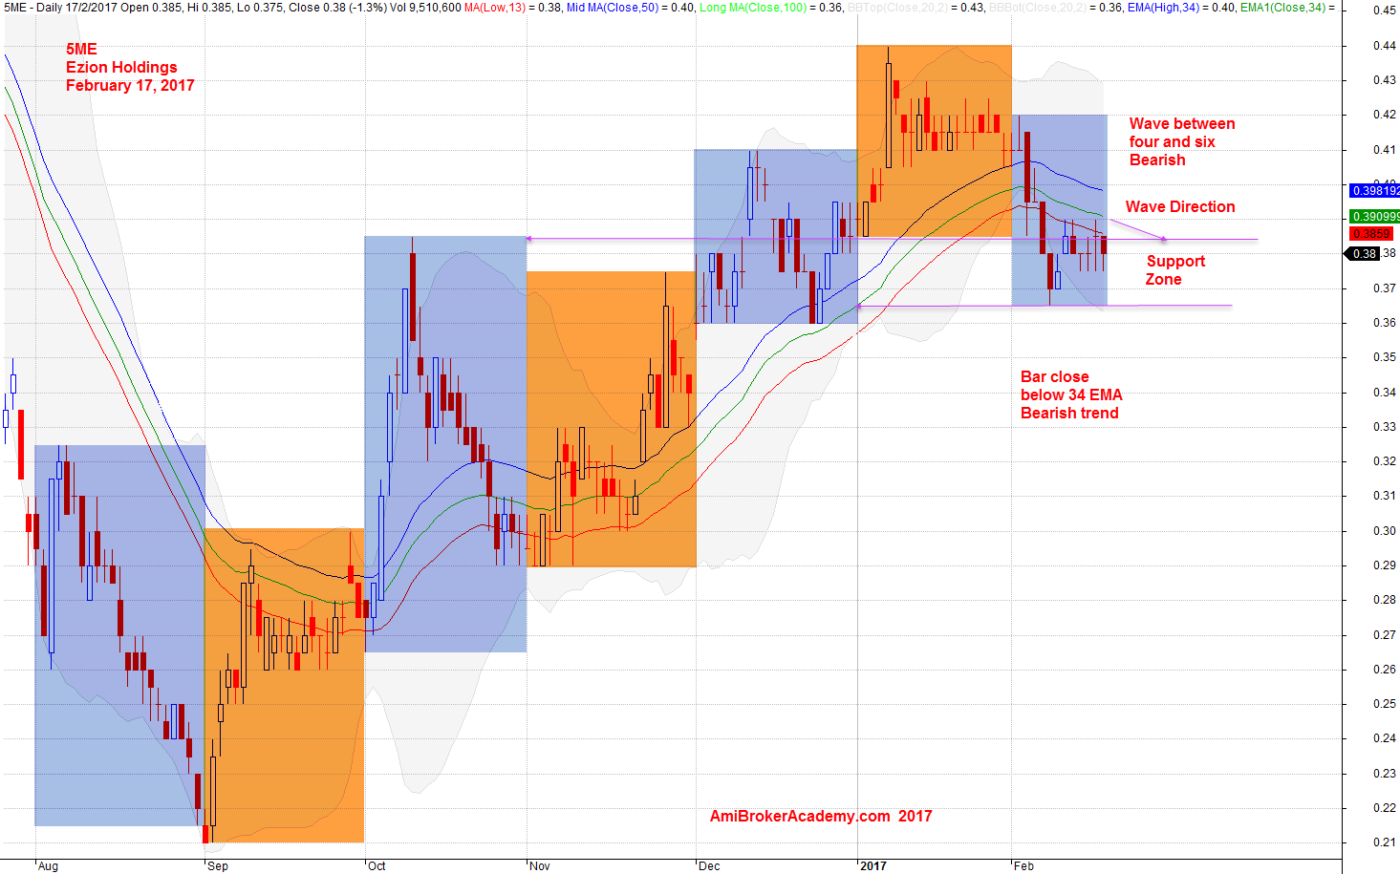
February 17, 2017 Ezion Holdings and 34 EMA Wave
Moses
AmiBrokerAcademy.com
Disclaimer
The above result is for illustration purpose. It is not meant to be used for buy or sell decision. We do not recommend any particular stocks. If particular stocks of such are mentioned, they are meant as demonstration of Amibroker as a powerful charting software and MACD. Amibroker can program to scan the stocks for buy and sell signals.
These are script generated signals. Not all scan results are shown here. The MACD signal should use with price action. Users must understand what MACD and price action are all about before using them. If necessary you should attend a course to learn more on Technical Analysis (TA) and Moving Average Convergence Divergence, MACD.
Once again, the website does not guarantee any results or investment return based on the information and instruction you have read here. It should be used as learning aids only and if you decide to trade real money, all trading decision should be your own.