January 10, 2017
Stock Analysis – China Stock Benchmark – ^SSEC
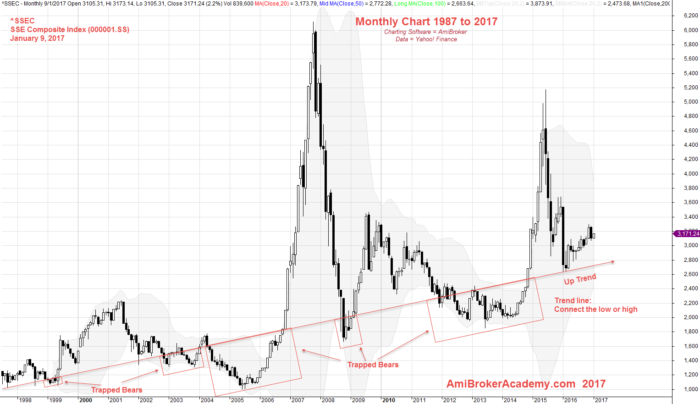
Shanghai Stock Exchange Composite Monthly Chart – Data from 1987 to 2017
Connecting the low, and you will see the line, trendline is slopping up, an up trending. Whatever those below the line was trapped bears.
January 10, 2017 Shanghai Stock Exchange Composite Index Monthly Chart – Data from 1988
Shanghai Stock Exchange Composite Monthly Chart Data from 2005 to 2017
The chart reflect the two recessions, one 2008 global recession, one 2016 Asia recession. We see an example of dead cat bounced.
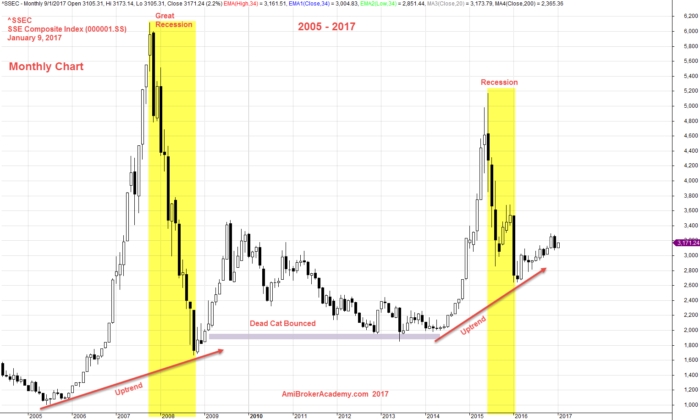
January 9, 2017 Shanghai SE Composite Index 2005 – 2017
Moses Stock Desk
AmiBrokerAcademy.com
Disclaimer:
The discussion here is for educational purposes only. All information, data, symbols and trading ideas discussed hereby are the author or authors intend to demonstrate or illustrate purposes only. These are not recommendations or advice. It is not to be construed or intended as providing trading or legal advice.
Besides that this discussion is not an offer or solicitation of any kind in any jurisdiction where any AmiBrokerAcademy.com or its affiliate is try to do business.
Please note that active trading is not suitable for everyone. Any decisions you make about your trading or investment are important to you and your family, therefore should be made in consultation with a competent financial advisor or professional. We are not financial advisor and do not claim to be one.
Any views expressed here-in are not necessarily those held by amibrokeracademy.com.