March 21, 2017
Moses Stock Trading Blog Site – AmiBrokerAcademy.com
Thank you for visiting the amibrokeracademy.com. No one doing analysis like what you read here.
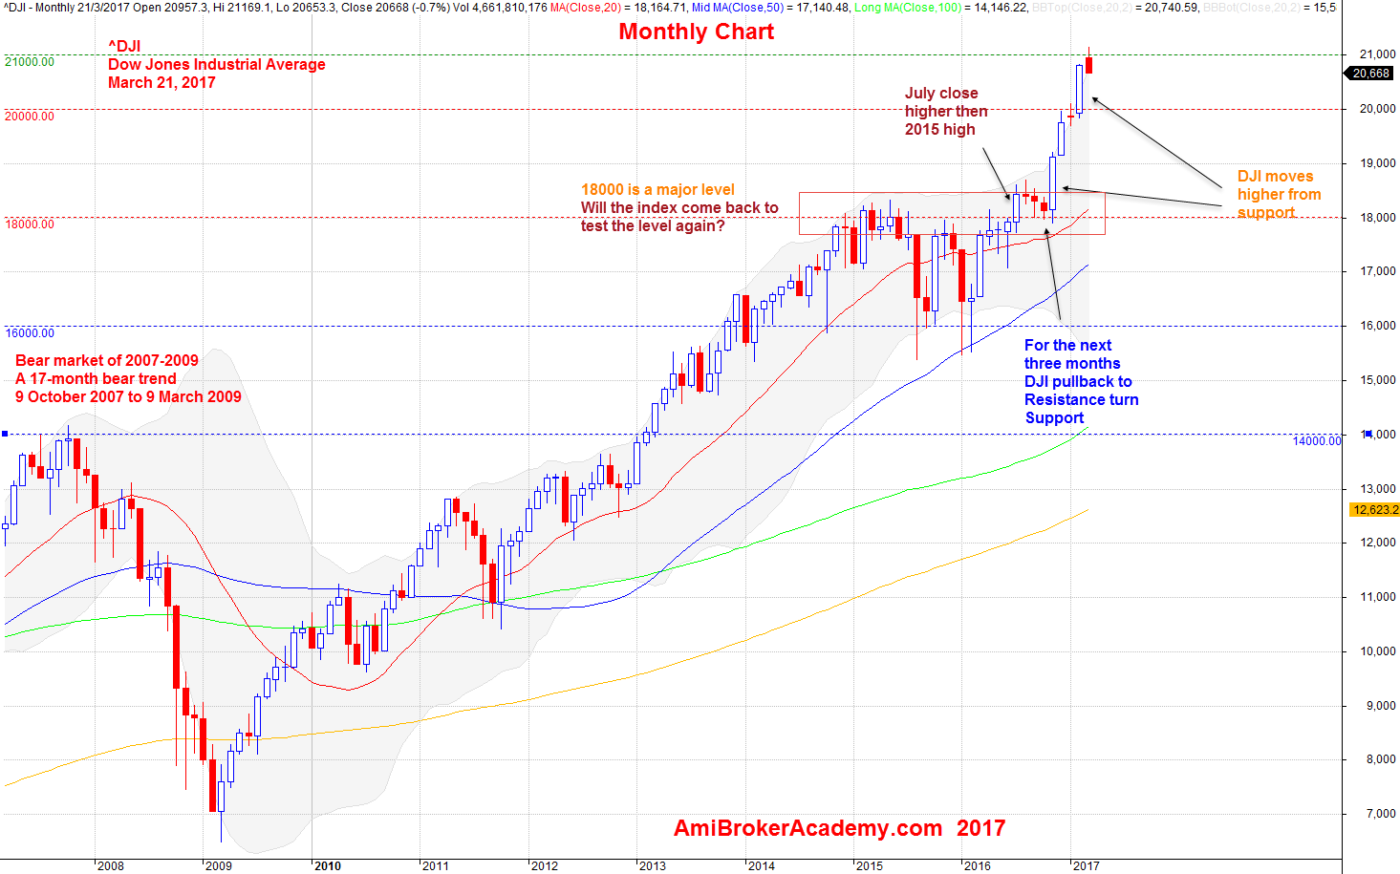
^DJI Dow Jones Industrial Average Monthly Chart Analysis
Picture worth a thousand words, see chart for more. October 9, 2007 the market begin the bear trend, it lasted seventeen months till March 9, 2009. DJI went as low as below 7000 points. The bull fight back, but fail see many long tail candlestick. After March 2009, the market turn bull. Bull lead the market till now. Of course, there were major pullback.
DJI struggle to breakout higher in the 18,000 level. Finally the resistance turn support, DJI got supported, DJI bounced up in November 2016 and continue the bull trend.
March 21, 2017 Dow Jones Industrial Average Monthly Chart
To have the index gap is not easy. But these days it is like a common feature. See Dow gaps for more.
Remember, we are only sharing the experience and for the education purpose. We do not provide buy or sell signal, please seek your trade adviser for their expert advice. Besides that you are responsible for your own action. Trading is personal, even you can enter the trade at the exact same manner, you may not make money.
Remember too, trading is not a get rich fast business like many have advertise. It needs a lot of hard work and good money and risk management.
Have fun! Happy learning.
Moses US Stock Analysis
AmiBrokerAcademy.com
Disclaimer
The above result is for illustration purpose. It is not meant to be used for buy or sell decision. We do not recommend any particular stocks. If particular stocks of such are mentioned, they are meant as demonstration of Amibroker as a powerful charting software and MACD. Amibroker can program to scan the stocks for buy and sell signals.
These are script generated signals. Not all scan results are shown here. The MACD signal should use with price action. Users must understand what MACD and price action are all about before using them. If necessary you should attend a course to learn more on Technical Analysis (TA) and Moving Average Convergence Divergence, MACD.
Once again, the website does not guarantee any results or investment return based on the information and instruction you have read here. It should be used as learning aids only and if you decide to trade real money, all trading decision should be your own.