January 23, 2018
Singapore Stock Analysis
Powerful Chart Software – AmiBroker
The following chart is produced using AmiBroker charting software. It is a powerful chart software. You plot the stocks you are interested all in one chart, as long as you still could read them. See chart below. Thereafter slowly climb up, step by step.
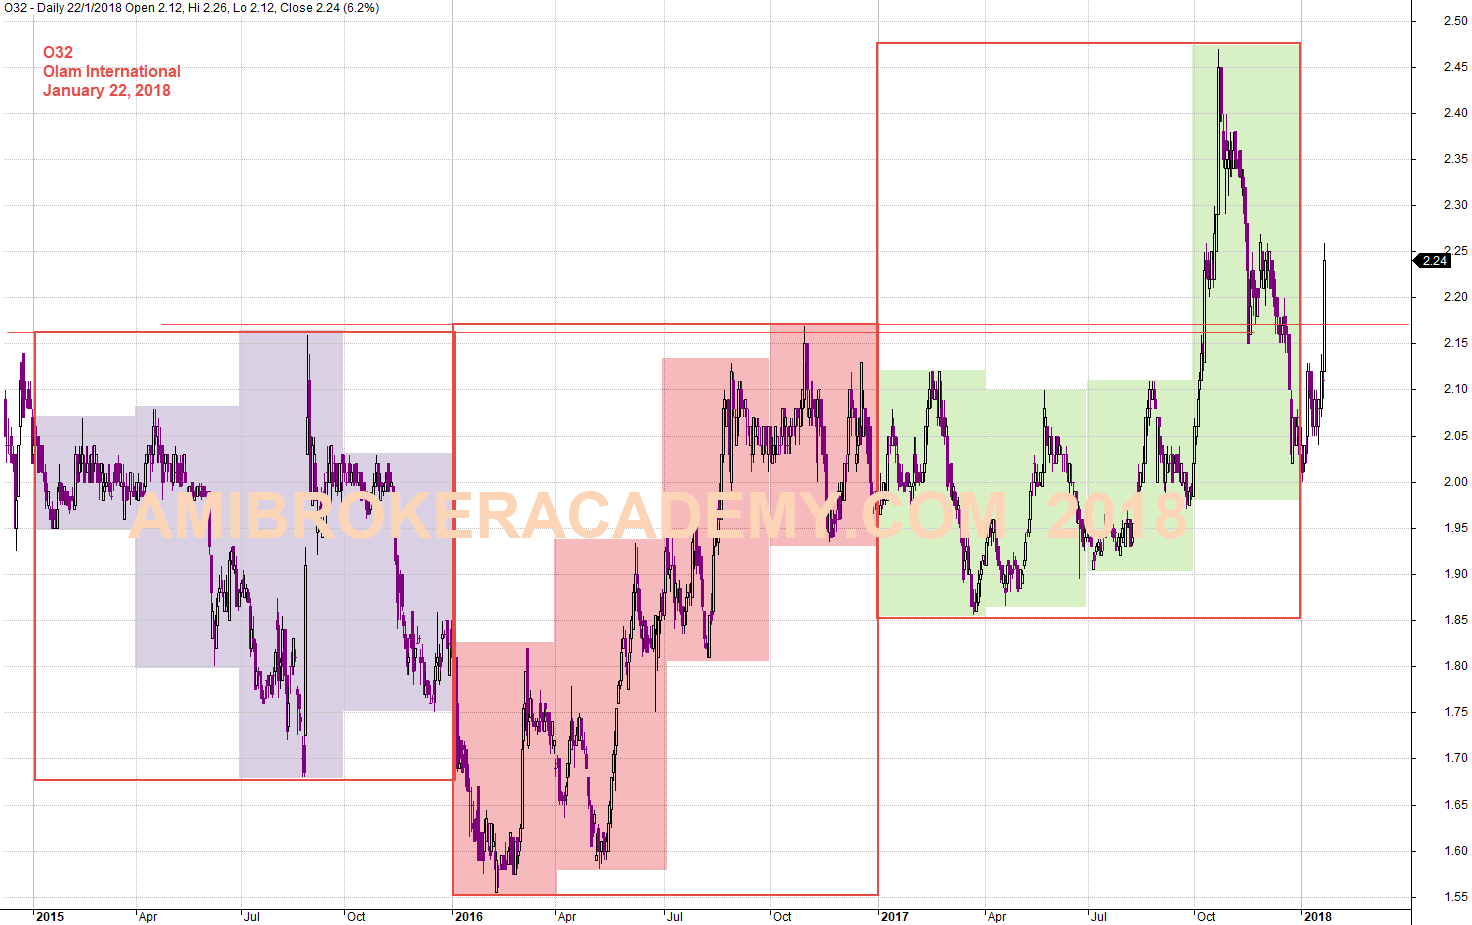
O32 Olam International Quarter and Year High Low
Study the Olam chart, Olam stock price tested and retested 2.15 in 2015 and 2016, and finally the stock price manage to breakout the resistance and went higher in 2017. If you are a pattern guy, you may see pattern like cup and handle and so on so for.
Have fun!
January 22, 2018 Olam International Quarter and Year High Low
Zoom Out O32 Olam International See Year High Low Again
Picture worth a thousand words, see any interest pattern, may be triangle.
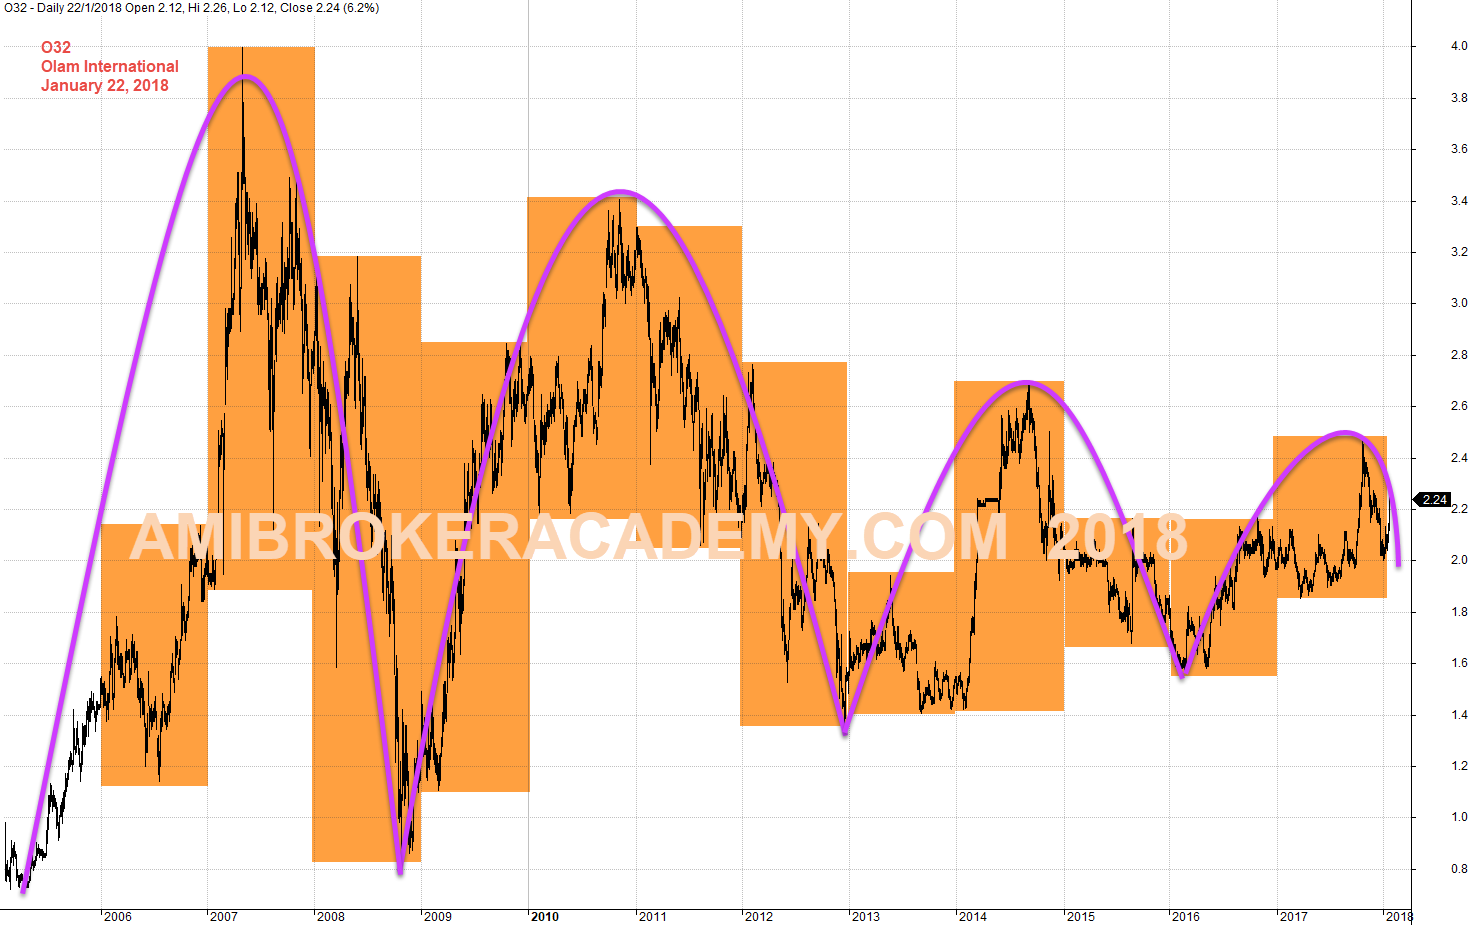
January 22, 2018 Zoom out Olam International and See the year High Low again
Moses
AmiBrokerAcademy.com
Disclaimer
The above result is for illustration purpose. It is not meant to be used for buy or sell decision. We do not recommend any particular stocks. If particular stocks of such are mentioned, they are meant as demonstration of Amibroker as a powerful charting software and MACD. Amibroker can program to scan the stocks for buy and sell signals.
These are script generated signals. Not all scan results are shown here. The MACD signal should use with price action. Users must understand what MACD and price action are all about before using them. If necessary you should attend a course to learn more on Technical Analysis (TA) and Moving Average Convergence Divergence, MACD.
Once again, the website does not guarantee any results or investment return based on the information and instruction you have read here. It should be used as learning aids only and if you decide to trade real money, all trading decision should be your own.