September 3, 2016
S41 Hong Leong Finance Stock Charting
Price bounces off and below moving average, MA. Bearish bias. Price action crosses 20 MA and resisted 50 MA. Price fail to move higher than the last high. Reversal fail.
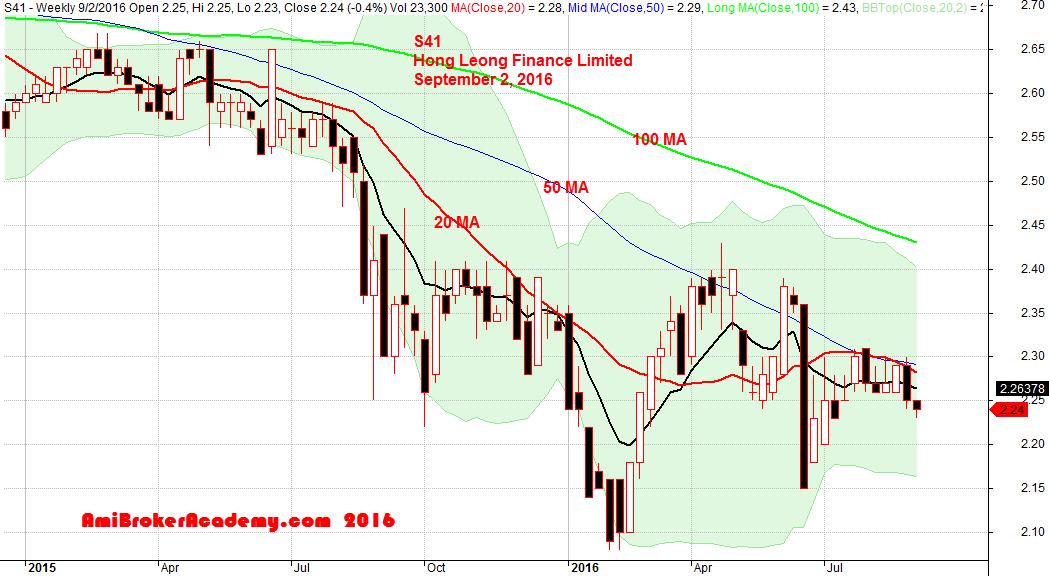
September 2, 2016 Hong Leong Finance Weekly Chart
MACD and S41 Hong Leong Finance Stock Chart
Gartley 222 Chart Pattern provides with confident on the trend and price action.
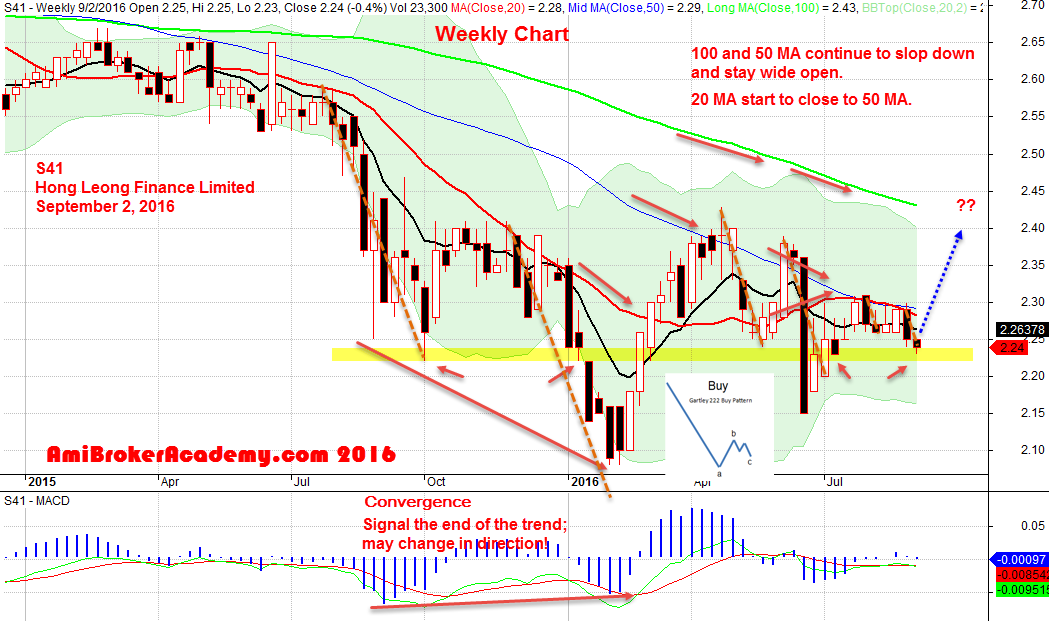
September 2, 2016 Hong Leong Finance Weekly and MACD Chart
Moses Stock Column
AmiBrokerAcademy.com
Disclaimer: All information, data and material contained, presented, or provided on amibrokeracademy.com is for educational purposes only. It is not to be construed or intended as providing trading or legal advice. Decisions you make about your trading or investment are important to you and your family, therefore should be made in consultation with a competent financial advisor or professional. We are not financial advisor and do not claim to be. Any views expressed here-in are not necessarily those held by amibrokeracademy.com. You are responsible for your trade decision and wealth being.