August 28, 2016
In trading, it is so important to recognise the pattern as the history will repeat itself. Is the stock performance connecting with the company performance? Likewise is the index performance connecting with the market performance? Well, will see.
The following is an observation that is against “The random walk hypothesis”, a financial theory. When the stock market prices evolve according to a random walk and thus cannot be predicted of the efficient-market hypothesis. True or true?
However, for the chart below, you will agree that even the pattern is great, but there is no same answer.
Straits Times Index and Butterfly Chart Pattern
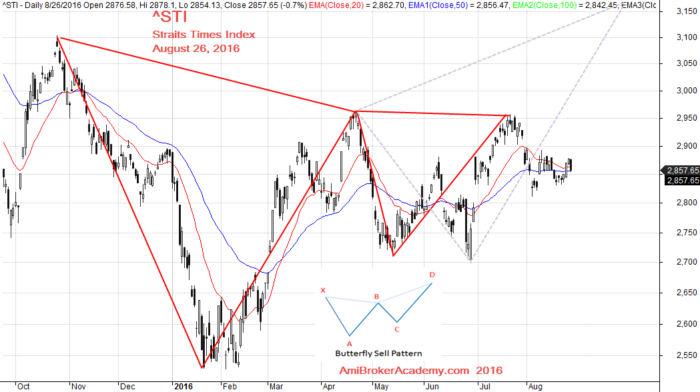
August 26, 2016 Straits Times Index Daily Chart and Butterfly Chart Pattern
Straits Times Index ^STI and Butterfly Sell Chart Pattern
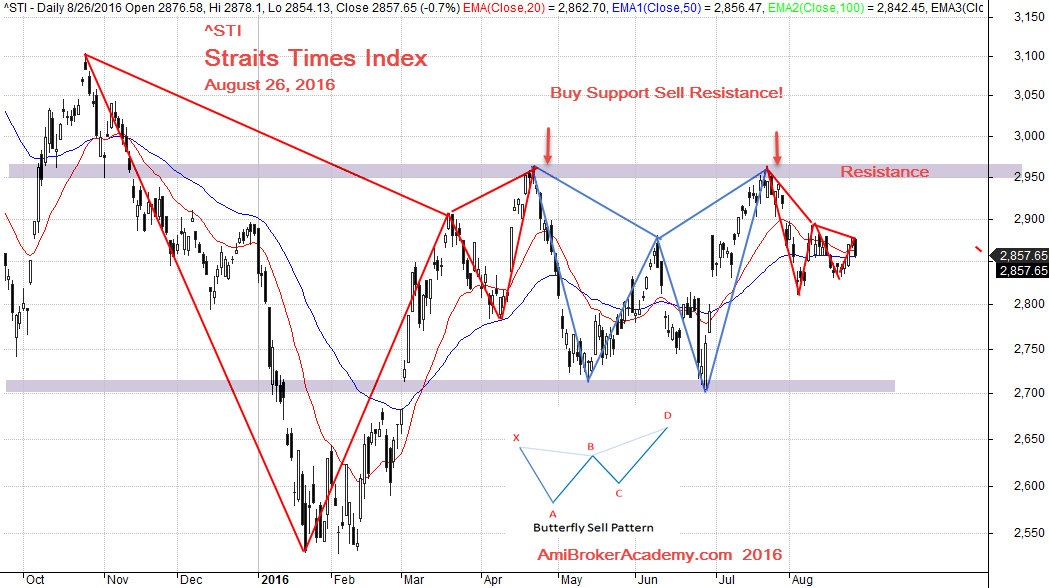
August 26, 2016 Straits Times Index ^STI and Butterfly Chart Pattern
Moses Stock Column
AmiBrokerAcademy.com
Disclaimer: All information, data and material contained, presented, or provided on amibrokeracademy.com is for educational purposes only. It is not to be construed or intended as providing trading or legal advice. Decisions you make about your trading or investment are important to you and your family, therefore should be made in consultation with a competent financial advisor or professional. We are not financial advisor and do not claim to be. Any views expressed here-in are not necessarily those held by amibrokeracademy.com. You are responsible for your trade decision and wealth being.