April 12, 2017
Thank you for visiting the amibrokeracademy.com blog site.
The illustration here shows power of AmiBroker charting software, AmiBroker can plot any chart like the following. As long as the data can be downloaded by AmiBroker tool, such as AmiQuote.
^XAU PHLX Gold Silver Index Daily Chart and MACD Indicator
Picture worth a thousand words.
We see the trend change each time the divergence appear. Study the chart carefully.
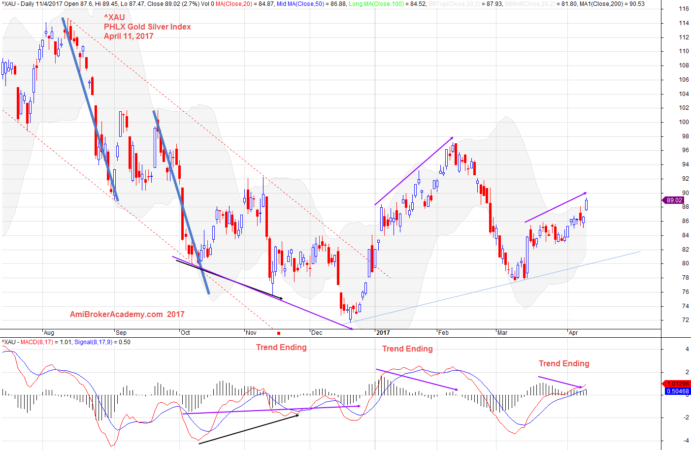
20170411 PHLX Gold Silver Index and MACD Indicator
^XAU PHLX Gold Silver Index Daily Chart, Fibonacci and Gartley
Risk management, see the Fibonacci and Gartley pattern.
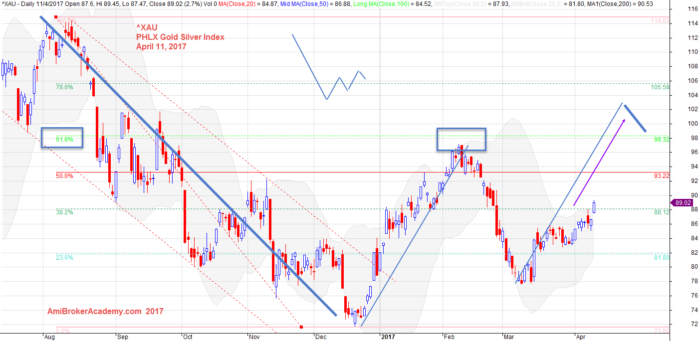
April 11, 2017 PHLX Gold Silver Index and Fibonacci and Gartley
Nothing is 100%!
Happy learning.
Moses Stock Analysis
AmiBrokerAcademy.com
Disclaimer
The above result is for illustration purpose. It is not meant to be used for buy or sell decision. We do not recommend any particular stocks. If particular stocks of such are mentioned, they are meant as demonstration of Amibroker as a powerful charting software and MACD. Amibroker can program to scan the stocks for buy and sell signals.
These are script generated signals. Not all scan results are shown here. The MACD signal should use with price action. Users must understand what MACD and price action are all about before using them. If necessary you should attend a course to learn more on Technical Analysis (TA) and Moving Average Convergence Divergence, MACD.
Once again, the website does not guarantee any results or investment return based on the information and instruction you have read here. It should be used as learning aids only and if you decide to trade real money, all trading decision should be your own.