26 October 2016
PEP Pepsico Inc Daily and MACD
MACD Cross-up Zeroline, is a bullish signal. Potentially the trend will be bullish. But, see the downside too. It can also has the ABCD Chart pattern just plotted at the chart. Be aware.
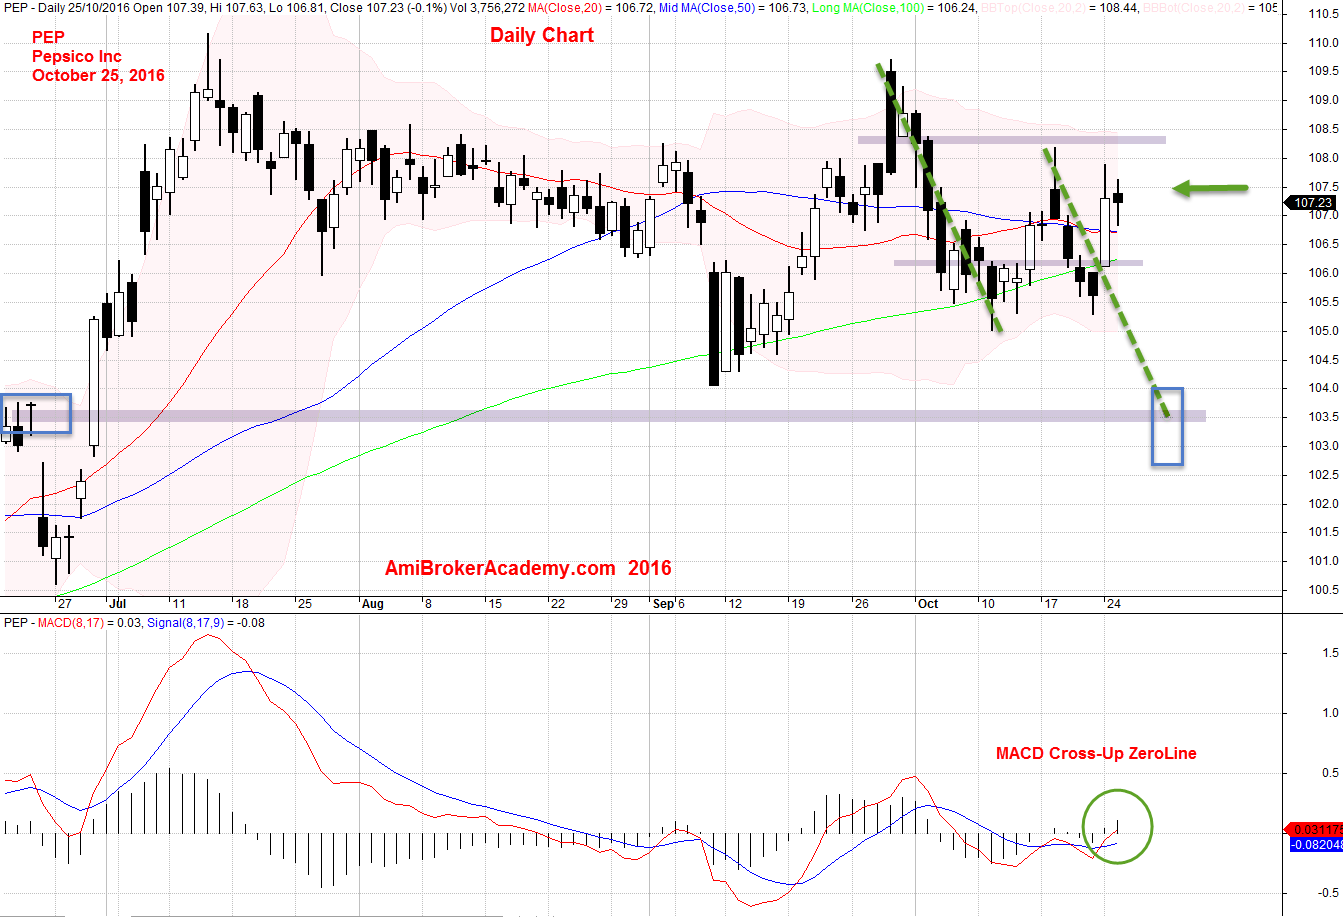
October 25, 2016 Pepsico Inc Daily and MACD
PEP Pepsico Inc Daily and Wave
This is not a smooth wave, the price crosses up and down of the wave. Although the clock is pointing up between twelve and two o’clock. Stand aside, if you do not want to risk your capital.
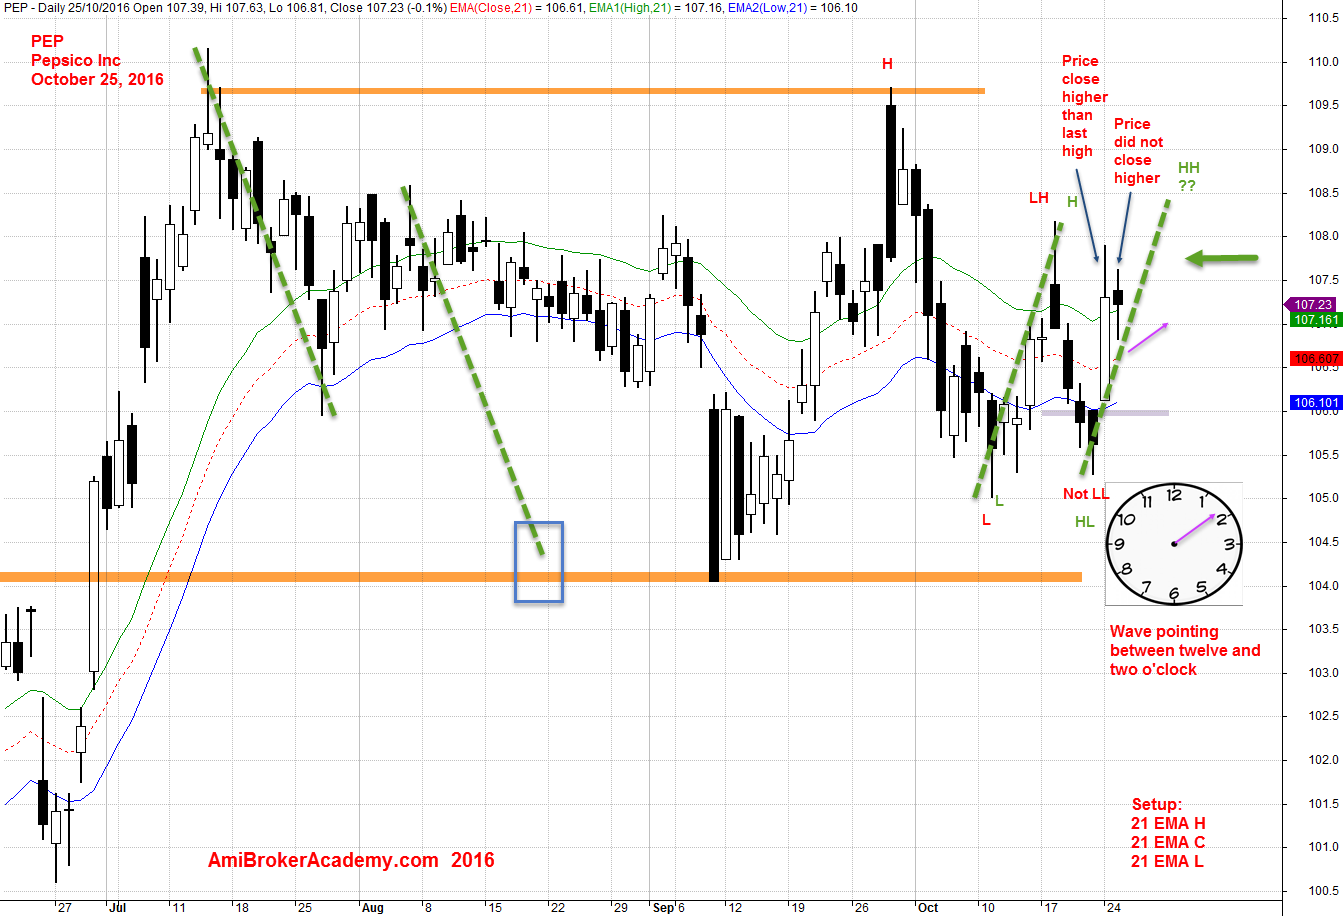
October 25, 2016 Pepsicl Inc Daily and 21 EMA Wave
Moses US Stock Desk
AmiBrokerAcademy.com
Disclaimer:
The discussion here is for educational purposes only. All information, data, symbols and trading ideas discussed by the author or authors are for demonstration or illustration purposes only and are not recommendations. It is not to be construed or intended as providing trading or legal advice.
This discussion is not an offer or solicitation of any kind in any jurisdiction where any AmiBrokerAcademy.com or its affiliate is try to do business.
Please note that active trading is not suitable for everyone. Decisions you make about your trading or investment are important to you and your family, therefore should be made in consultation with a competent financial advisor or professional. We are not financial advisor and do not claim to be.
Any views expressed here-in are not necessarily those held by amibrokeracademy.com.
We do not represent the external reference, or reference. We can not be responsible for their views and site availability.