February 11, 2018
Pattern Trader
This is for visitor read very single line on the website. We are very interested in pattern, sometime back, we ask everyone to look left and find a similar pattern for STI. After the index break a high, and ST Index start to decline, and fail to go any higher for a long time. So, when ST Index breakout the new high this year in our posting we hint that to watch out a similar pattern may happen again. As market has memory, the market like to play back the history.
Powerful Chart Software – AmiBroker
The following chart is produced using AmiBroker charting software. It is a powerful chart software. You plot the stocks you are interested all in one chart, as long as you still could read them. See chart below. Thereafter slowly climb up, step by step.
miracle
Have you even thought how can a stock price that is on a rise have a pullback and big real pullback, just like the correction that is happened currently in almost all the markets this last ten days? We would sometime accept it as miracle.
The only possible that may come close in TA is Fibonacci and HM Gartley.
^STI Straits Times Index Charting and Level
We studied chart; look left and think right see many ABCD pattern in our last post. We see STI break the July high and retest the high in October, STI just went higher with a retest of the same level 3350 in mid November. These was just happen last year, with all the hard work ST has finally breakout higher 3600, a record high. Just less than ten days, everything back to square one. The index now goes below 3350, only good thing is ST Index close above the level. Otherwise the bearish will be even worsen.
Go a look further left, if you can not find it I will post it latter.
Have fun!
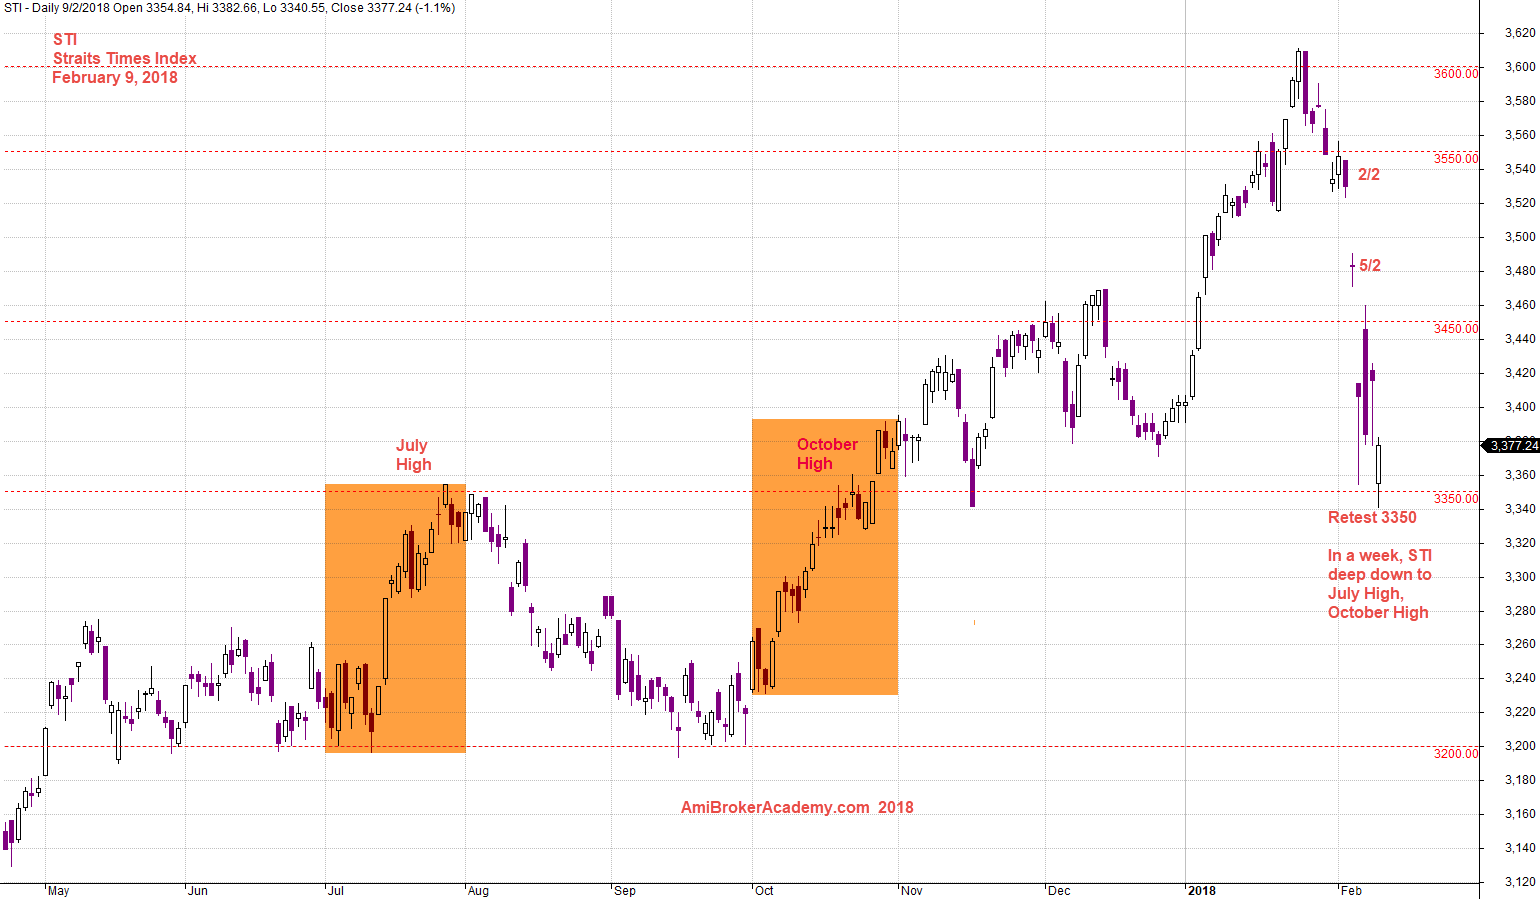
February 9, 2018 Straits Times Index and Level 3350
^STI ST Index and MACD
See chart price has a bearish MACD bias signals.
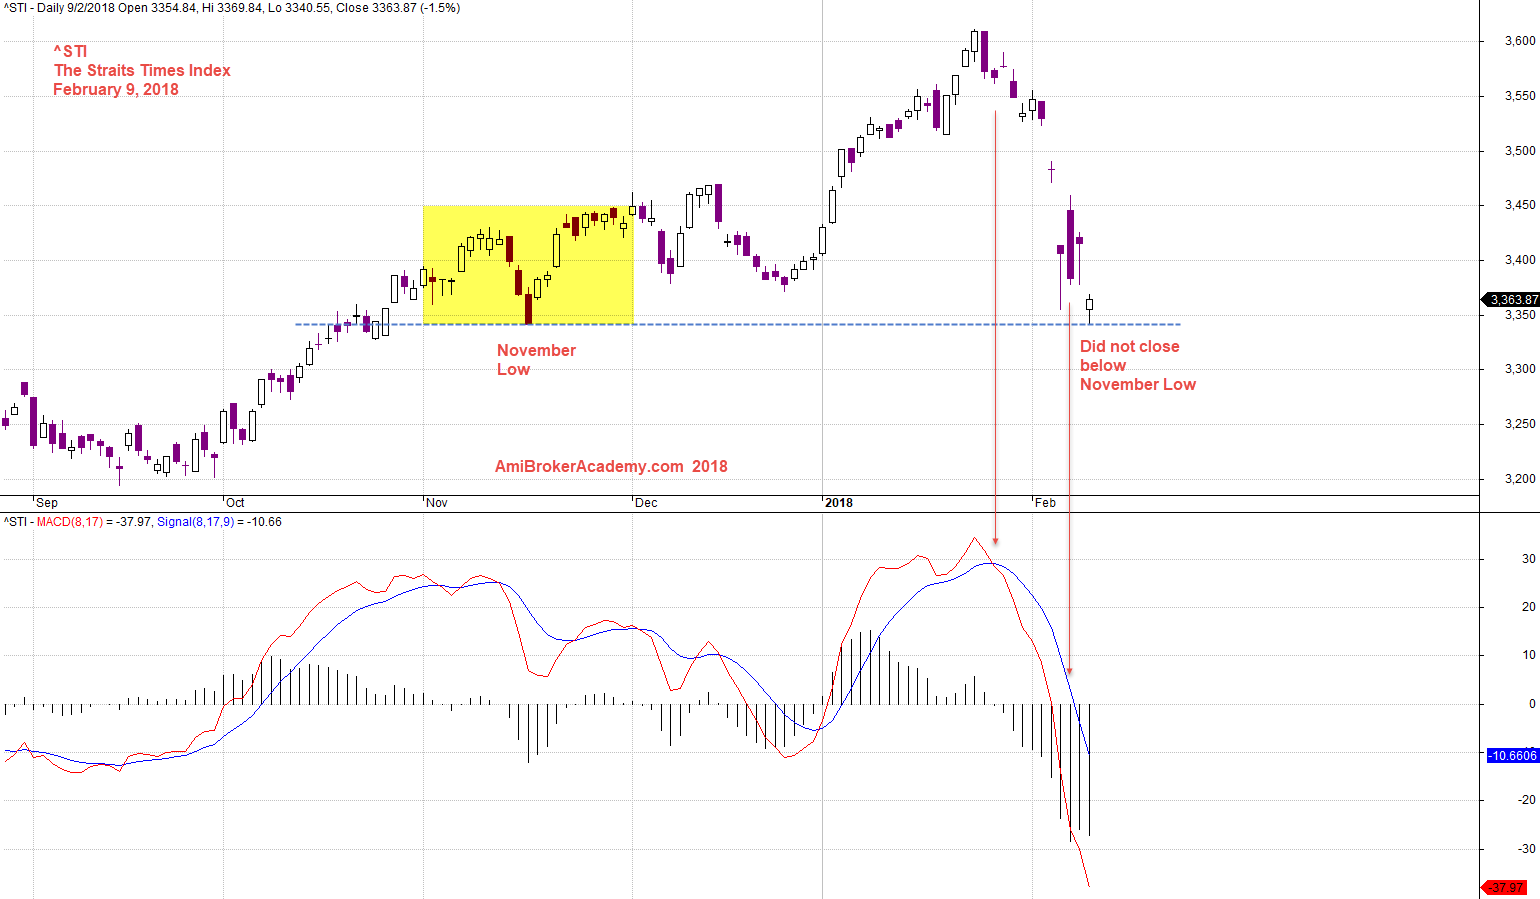
February 9, 2018 Straits Times Index and MACD Signals
Moses
AmiBrokerAcademy.com
Disclaimer
The above result is for illustration purpose. It is not meant to be used for buy or sell decision. We do not recommend any particular stocks. If particular stocks of such are mentioned, they are meant as demonstration of Amibroker as a powerful charting software and MACD. Amibroker can program to scan the stocks for buy and sell signals.
These are script generated signals. Not all scan results are shown here. The MACD signal should use with price action. Users must understand what MACD and price action are all about before using them. If necessary you should attend a course to learn more on Technical Analysis (TA) and Moving Average Convergence Divergence, MACD.
Once again, the website does not guarantee any results or investment return based on the information and instruction you have read here. It should be used as learning aids only and if you decide to trade real money, all trading decision should be your own.