October 7, 2017
OKP Holdings and Levels
See chart, picture worth a thousand words, the chart says it all. See the power of the support resistance. The price drop after it test 49 cents. This the first attempt to test such a high after four years. The stock after the high near sixty eight cents in 2011, the price just keep declining. 2015 is the worst for the stock. It tested eighteen cents.
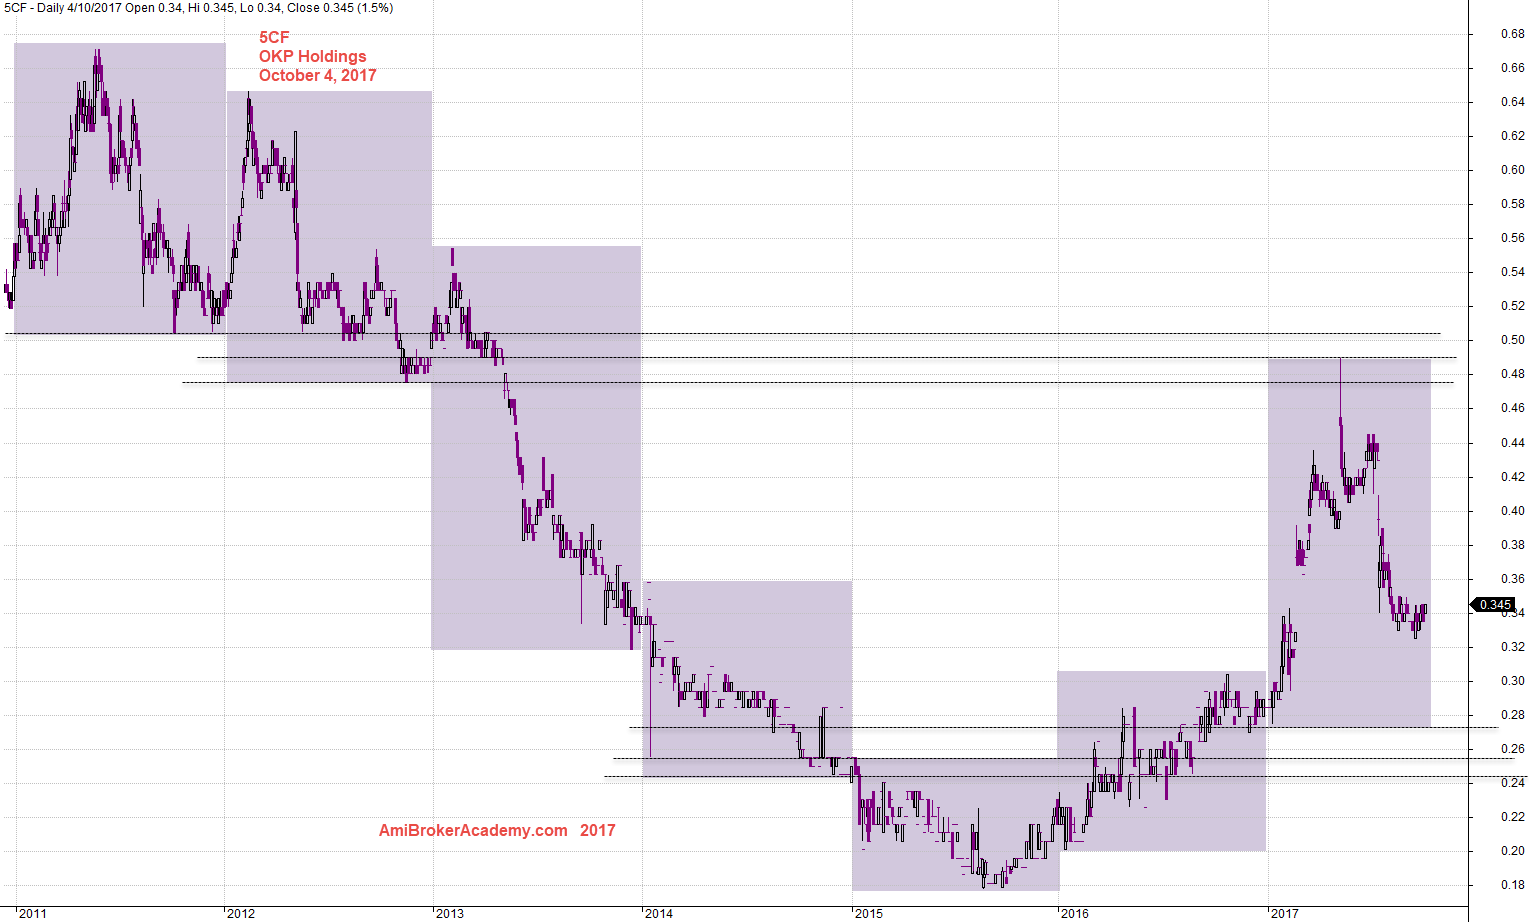
October 4, 2017 OKP Holdings and Levels
5CF OKP Holdings and Channel
See chart, picture worth a thousand words, the chart says it all. Compare the chart and the above one, you can see a vast different. Without the channel, you probably can not figure out what is your trade plan. But with the support resistance level, it is much easier for you to decide. Have fun!
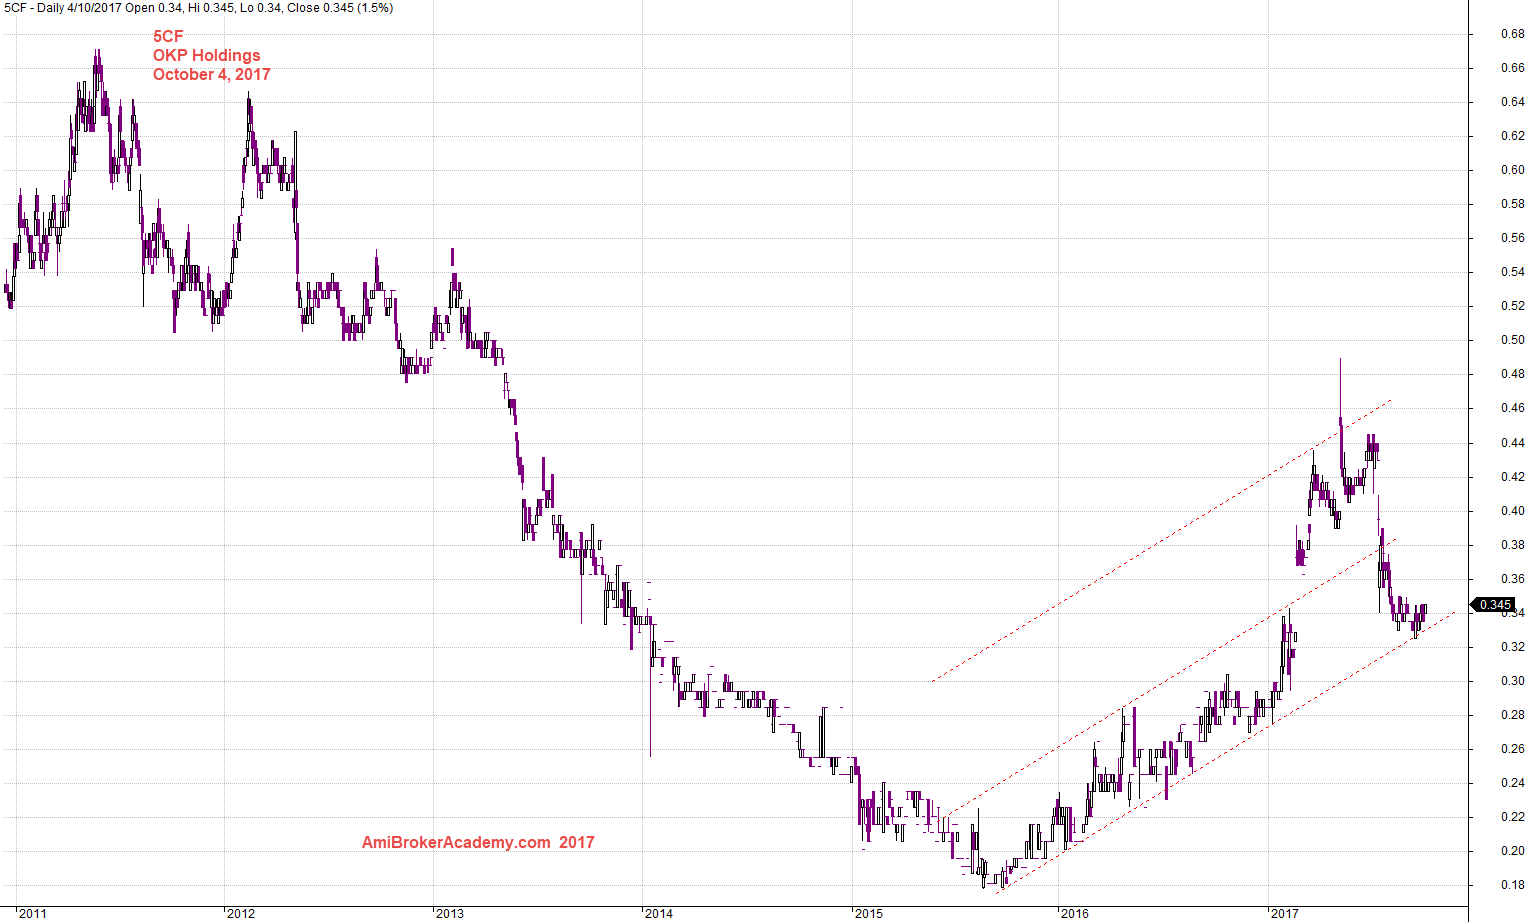
October 4, 2017 OKP Holdings and Channel
Moses
AmiBrokerAcademy.com
Disclaimer
The above result is for illustration purpose. It is not meant to be used for buy or sell decision. We do not recommend any particular stocks. If particular stocks of such are mentioned, they are meant as demonstration of Amibroker as a powerful charting software and MACD. Amibroker can program to scan the stocks for buy and sell signals.
These are script generated signals. Not all scan results are shown here. The MACD signal should use with price action. Users must understand what MACD and price action are all about before using them. If necessary you should attend a course to learn more on Technical Analysis (TA) and Moving Average Convergence Divergence, MACD.
Once again, the website does not guarantee any results or investment return based on the information and instruction you have read here. It should be used as learning aids only and if you decide to trade real money, all trading decision should be your own.