April 3, 2017
Moses Stock Trading Blog Site – AmiBrokerAcademy.com
Thank you for visiting the amibrokeracademy.com blog site. No one doing analysis like what you read here.
Welcome to Moses’s US Stock Analysis @ AmiBrokerAcademy.com.
Remember, trading is not a get rich fast business like many have advertised. It needs a lot of hard work and good money to manage risk.
Deepak Chopra always suggest to remain childlike. Children always amazes about their encounter, they see everyday a new adventure. With the market remains unknown, do not be blinded by anything you hear. Here we suggest all traders to be childlike, without being taught “fear”, they do not know the limit like. Be aware, the market may look “sweet” but full of traps.
All traders stay vigilant and trade carefully.
Those whom have bought or invest in stock in the recent months or so, especially those whom join later may have to wait longer to be profitable, in other words they have been trapped, a bull trapped. In simple English, is in a losing position right now.
Picture worth a thousand words. It is your fate if you are here for the first time.
Are You Wise Enough?
It is always wise to ask whether this is the top in the stock market before you jump in. Professional traders like to buy on pullback so they can buy low sell high.
Be on your toe, when the market take a deep dip. Okay!
Have fun learning! Stay childlike.
^NYA Daily Chart and ABCD Chart Pattern
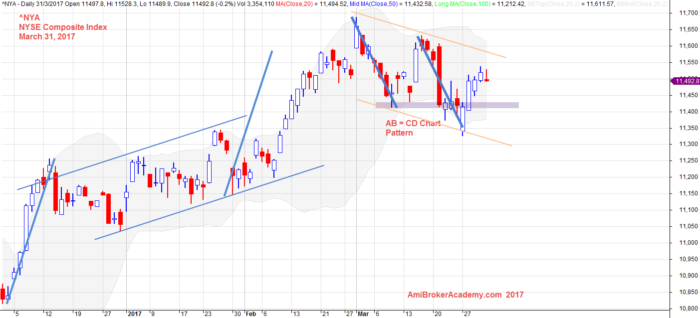
March 31, 2017 NYSE Composite Index and AB CD Chart Pattern
NYSE Composite Index and MACD Indicator
No indicator like MACD it is so simple yet so clear. Picture worth a thousand words, read the chart for yourself. If you do not know MACD, please google and find out more.
How much have you trapped?
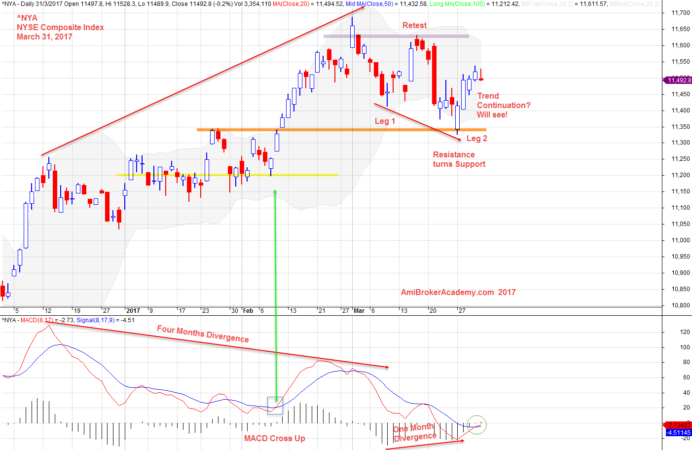
March 31, 2017 NYSE Composite Index and MACD Indicator.
Happy learning.
Moses US Stock Analysis
AmiBrokerAcademy.com
Disclaimer
The above result is for illustration purpose. It is not meant to be used for buy or sell decision. We do not recommend any particular stocks. If particular stocks of such are mentioned, they are meant as demonstration of Amibroker as a powerful charting software and MACD. Amibroker can program to scan the stocks for buy and sell signals.
These are script generated signals. Not all scan results are shown here. The MACD signal should use with price action. Users must understand what MACD and price action are all about before using them. If necessary you should attend a course to learn more on Technical Analysis (TA) and Moving Average Convergence Divergence, MACD.
Once again, the website does not guarantee any results or investment return based on the information and instruction you have read here. It should be used as learning aids only and if you decide to trade real money, all trading decision should be your own.