December 1, 2016
US Stock Analysis – ^NDX
^NDX | NASDAQ 100 Stock Chart
Only one month to go, the year will be ending, 2017 will start. Is the last few months, since September the index already testing the peak of 2016. It is pretty clear that the price action can not break even higher so far. The price action has been test, retest the same level since September.
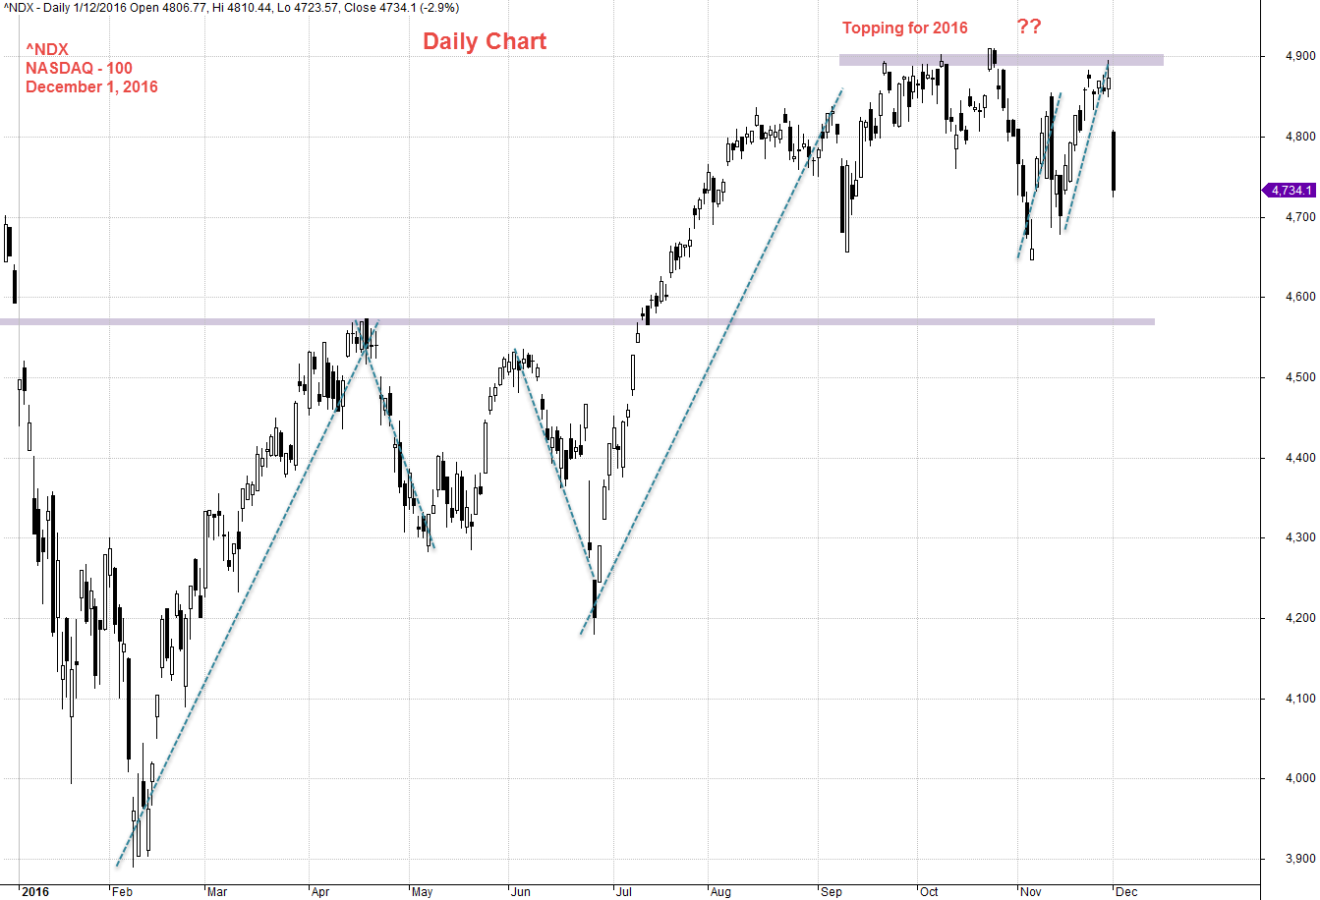
December 1, 2016 NASDAQ 100 Daily Chart
NASDAQ 100 Stock Chart Analysis
The index stay on the same high for eleven weeks. None of the bar are able to close higher than 4900. Is this a Gartley ABCD Sell pattern? Will see.
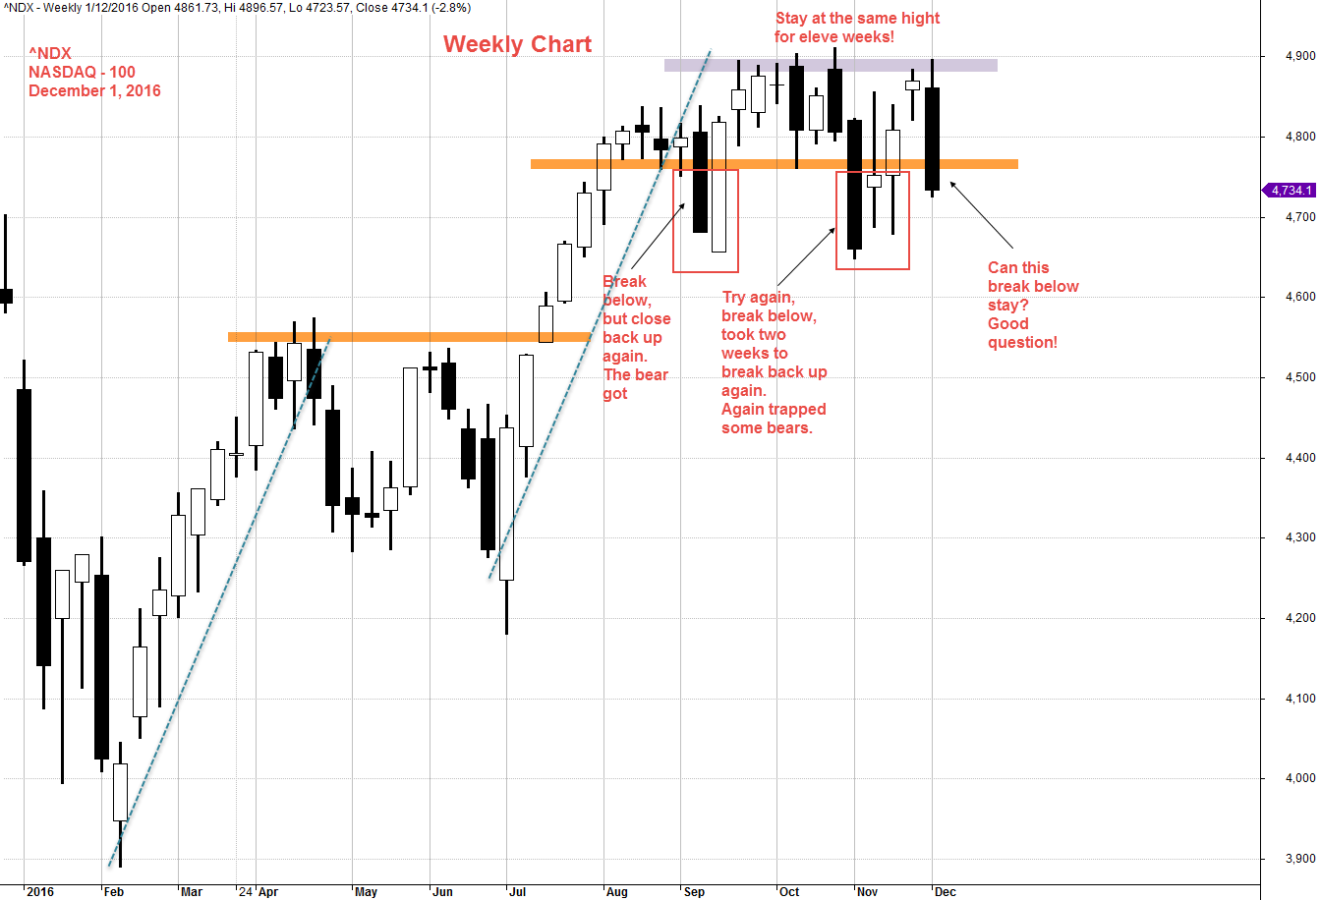
December 1, 2016 NASDAQ 100 Weekly Chart and ABCD Pattern
Moses Stock Desk
AmiBrokerAcademy.com
Disclaimer:
The discussion here is for educational purposes only. All information, data, symbols and trading ideas discussed hereby are the author or authors intend to demonstrate or illustrate purposes only. These are not recommendations or advice. It is not to be construed or intended as providing trading or legal advice.
Besides that this discussion is not an offer or solicitation of any kind in any jurisdiction where any AmiBrokerAcademy.com or its affiliate is try to do business.
Please note that active trading is not suitable for everyone. Any decisions you make about your trading or investment are important to you and your family, therefore should be made in consultation with a competent financial advisor or professional. We are not financial advisor and do not claim to be one.
Any views expressed here-in are not necessarily those held by amibrokeracademy.com.