November 4, 2017
N04 Dyna-MAC Holdings and Double Bottom
2017 started right, but after tested 22 cents the market disagree the price is right. The share price started to drift south, by March, the price close below 12 cents. The price retest 15 cents twice, but fail again. … See chart for more.
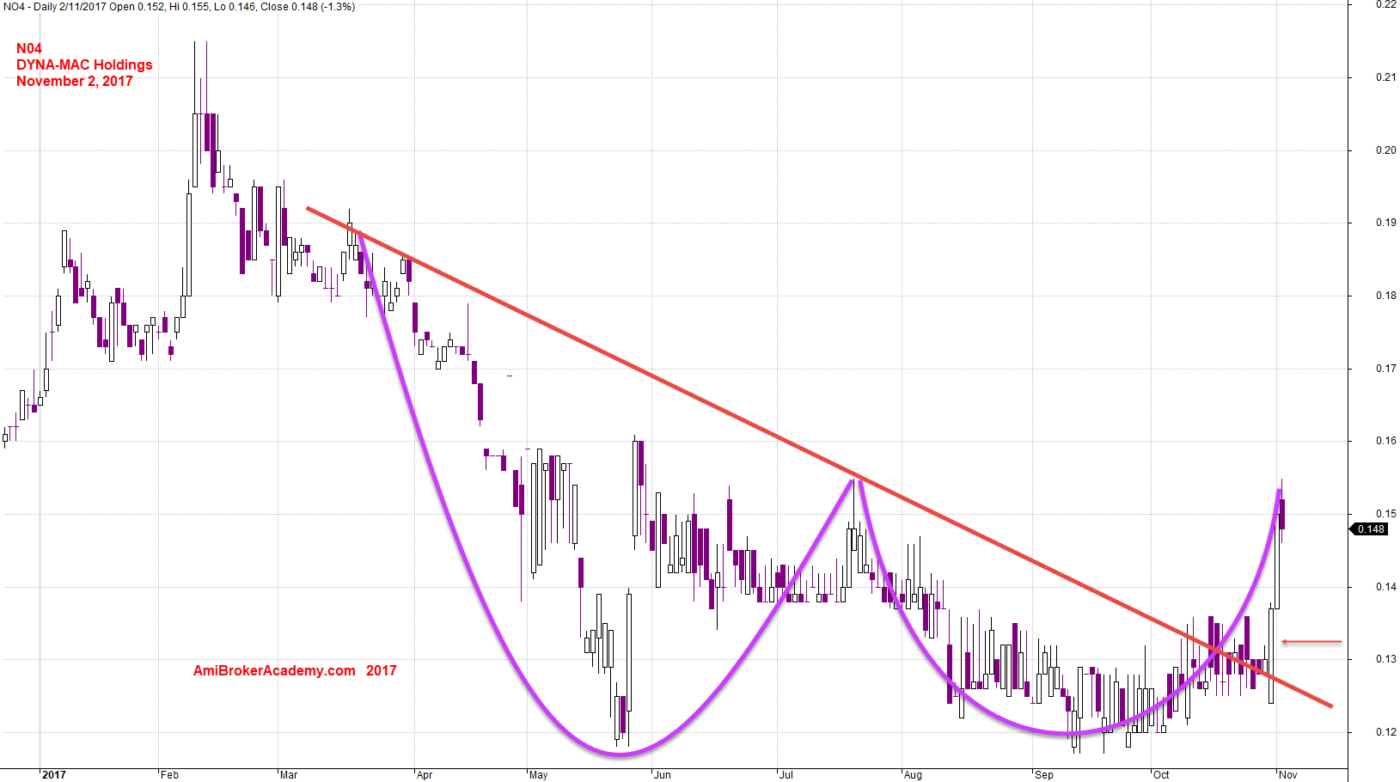
November 2, 2017 Dyna-MAC Holdings and Double Bottom
N04 Dyna-MAC Holdings and MACD Breakout Strategy
See chart for more.
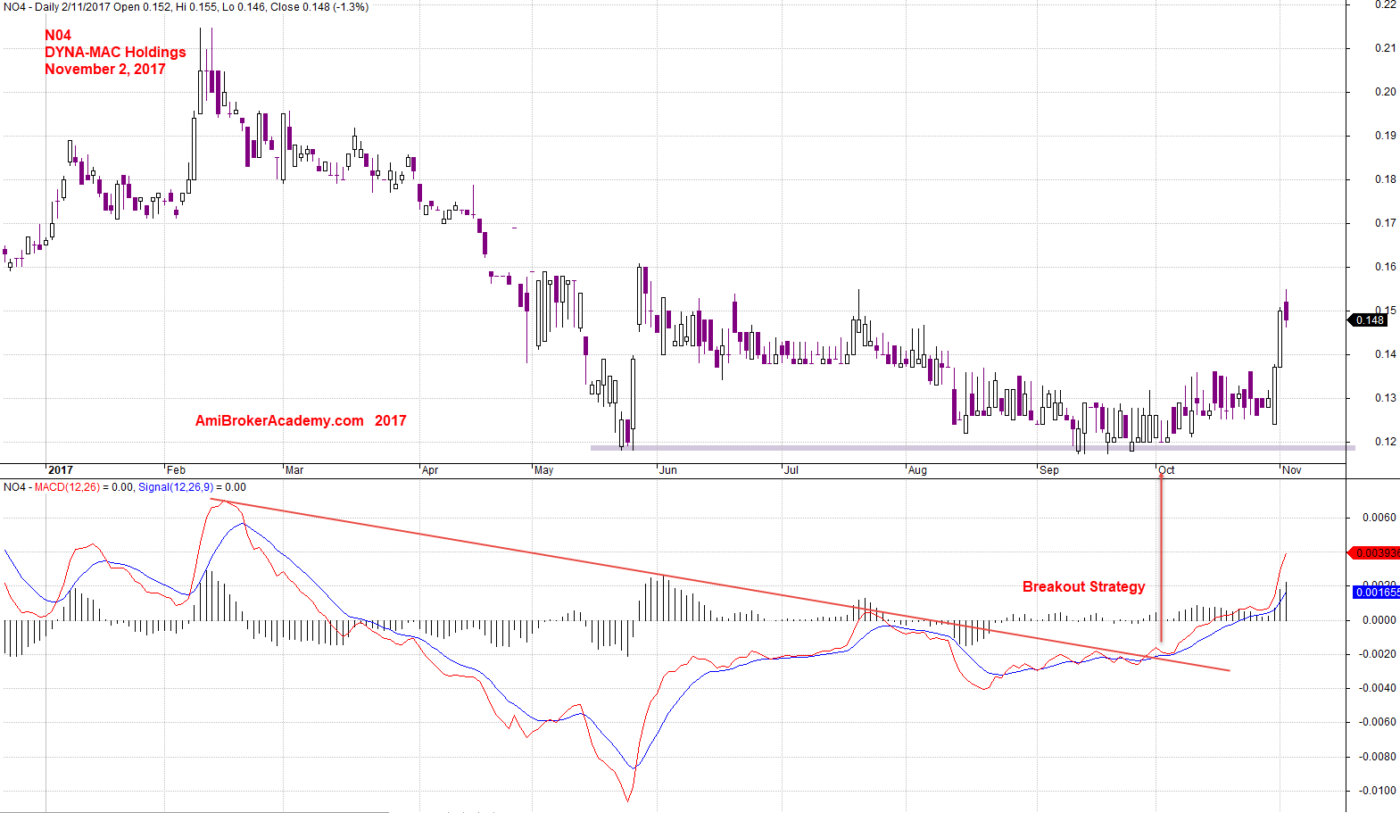
November 2, 2017 Dyna-MAC Holdings and MACD Breakout Strategy
Moses
AmiBrokerAcademy.com
Disclaimer
The above result is for illustration purpose. It is not meant to be used for buy or sell decision. We do not recommend any particular stocks. If particular stocks of such are mentioned, they are meant as demonstration of Amibroker as a powerful charting software and MACD. Amibroker can program to scan the stocks for buy and sell signals.
These are script generated signals. Not all scan results are shown here. The MACD signal should use with price action. Users must understand what MACD and price action are all about before using them. If necessary you should attend a course to learn more on Technical Analysis (TA) and Moving Average Convergence Divergence, MACD.
Once again, the website does not guarantee any results or investment return based on the information and instruction you have read here. It should be used as learning aids only and if you decide to trade real money, all trading decision should be your own.