November 13, 2014
Moving Average Convergence Divergence, MACD oscillator, is a trend following momentum indicator that shows the relationship of two moving averages of prices action; the MACD line and signal line.
Four ways to trade:
- Trade Breakout
- Trade with Trend
- Trade counter Trend
- Trade picks Tops or Bottoms
Four entry methods:
- Crossovers – Sell Strategy, MACD crosses below the signal line. Buy Strategy, MACD rallies above the signal line. It is advisable to wait for confirmation to reduce possible whipsaw.
- Divergence – The security price action diverges from the MACD. It signals the end of the current trend.
- Cross Zero Line – MACD moves above or below zero line. Upward trend: Cross above zero line, short MA above long MA. Downward trend: Cross below zero line, short MA below long MA.
- Dramatic rise or fall – MACD rises or decline dramatically – when the shorter moving average pulls away from the longer-term moving average – Oversold or Overbought.
6 November 2014, Thursday Free Singapore Stocks MACD Scan for Stocks closed greater than fifty (50) cents
- Stock closed more than fifty (50) cents and volume traded greater 500K
- MACD line crosses above MACD signal – Bullish trend
- MACD line crosses above zero line – Bullish trend
- MACD Histogram +ve Divergence – Bullish trend
- MACD line crosses below MACD signal – Bearish trend
- MACD line crosses below zero line – Bearish trend
- MACD Histogram -ve Divergence – Bearish trend
| Company | Date | Bias | Close | Vol.(K) |
| NOBLE GROUP LIMITED | 6/11/2014 | Bullish | 1.19 | 39018 |
| HUTCHISON PORT HOLDINGS TRUST | 6/11/2014 | Bullish | 0.69 | 16435 |
| SOILBUILD BUSINESS SPACE REIT | 6/11/2014 | Bullish | 0.79 | 1624 |
| BIOSENSORS INT’L GROUP, LTD. | 6/11/2014 | Bullish | 0.615 | 1526 |
| CORDLIFE GROUP LIMITED | 6/11/2014 | Bullish | 0.93 | 1321 |
| BREADTALK GROUP LIMITED | 6/11/2014 | Bullish | 1.37 | 795 |
| SPH REIT | 6/11/2014 | Bullish | 1.065 | 787 |
| GLOBAL LOGISTIC PROP LIMITED | 6/11/2014 | Bearish | 2.65 | 11553 |
| SEMBCORP INDUSTRIES LTD | 6/11/2014 | Bearish | 4.69 | 8368 |
| CAPITAMALL TRUST. | 6/11/2014 | Bearish | 1.95 | 6960 |
| KEPPEL REIT | 6/11/2014 | Bearish | 1.19 | 4487 |
| SIA ENGINEERING CO LTD | 6/11/2014 | Bearish | 4.42 | 1730 |
| CHINA SUNSINE CHEM HLDGS LTD. | 6/11/2014 | Bearish | 0.5 | 1697 |
| FRASERS CENTREPOINT TRUST | 6/11/2014 | Bearish | 1.9 | 1283 |
| CITY DEVELOPMENTS LIMITED | 6/11/2014 | Bearish | 9.41 | 774 |
| UNITED ENGINEERS LTD ORD | 6/11/2014 | Bearish | 2.87 | 763 |
| CAPITARETAIL CHINA TRUST | 6/11/2014 | Bearish | 1.59 | 615 |
| CITYSPRING INFRASTRUCT TRUST | 6/11/2014 | Bearish | 0.505 | 572 |
6 November 2014, Thursday Free Singapore Stocks MACD Scan for Stocks closed greater than ten (10) cents
- Stock closed more than ten (10) cents and volume traded greater 500K
- MACD line crosses above MACD signal – Bullish trend
- MACD line crosses above zero line – Bullish trend
- MACD Histogram +ve Divergence – Bullish trend
- MACD line crosses below MACD signal – Bearish trend
- MACD line crosses below zero line – Bearish trend
- MACD Histogram -ve Divergence – Bearish trend
| Company | Date | Bias | Close | Vol.(K) |
| NOBLE GROUP LIMITED | 6/11/2014 | Bullish | 1.19 | 39018 |
| HUTCHISON PORT HOLDINGS TRUST | 6/11/2014 | Bullish | 0.69 | 16435 |
| LIPPO MALLS INDO RETAIL TRUST | 6/11/2014 | Bullish | 0.375 | 3045 |
| SOILBUILD BUSINESS SPACE REIT | 6/11/2014 | Bullish | 0.79 | 1624 |
| BIOSENSORS INT’L GROUP, LTD. | 6/11/2014 | Bullish | 0.615 | 1526 |
| CORDLIFE GROUP LIMITED | 6/11/2014 | Bullish | 0.93 | 1321 |
| BREADTALK GROUP LIMITED | 6/11/2014 | Bullish | 1.37 | 795 |
| SPH REIT | 6/11/2014 | Bullish | 1.065 | 787 |
| COSMOSTEEL HOLDINGS LIMITED | 6/11/2014 | Bearish | 0.365 | 19726 |
| GLOBAL LOGISTIC PROP LIMITED | 6/11/2014 | Bearish | 2.65 | 11553 |
| SEMBCORP INDUSTRIES LTD | 6/11/2014 | Bearish | 4.69 | 8368 |
| CAPITAMALL TRUST. | 6/11/2014 | Bearish | 1.95 | 6960 |
| SYSMA HOLDINGS LIMITED | 6/11/2014 | Bearish | 0.265 | 6328 |
| KEPPEL REIT | 6/11/2014 | Bearish | 1.19 | 4487 |
| LCD GLOBAL INVESTMENTS LTD. | 6/11/2014 | Bearish | 0.285 | 4071 |
| SIA ENGINEERING CO LTD | 6/11/2014 | Bearish | 4.42 | 1730 |
| CHINA SUNSINE CHEM HLDGS LTD. | 6/11/2014 | Bearish | 0.5 | 1697 |
| FRASERS CENTREPOINT TRUST | 6/11/2014 | Bearish | 1.9 | 1283 |
| YING LI INTL REAL ESTATE LTD | 6/11/2014 | Bearish | 0.255 | 865 |
| CITY DEVELOPMENTS LIMITED | 6/11/2014 | Bearish | 9.41 | 774 |
| UNITED ENGINEERS LTD ORD | 6/11/2014 | Bearish | 2.87 | 763 |
| CAPITARETAIL CHINA TRUST | 6/11/2014 | Bearish | 1.59 | 615 |
| CITYSPRING INFRASTRUCT TRUST | 6/11/2014 | Bearish | 0.505 | 572 |
Chart worth a thousand words, see Noble Group Limited why top volume on bullish bias.
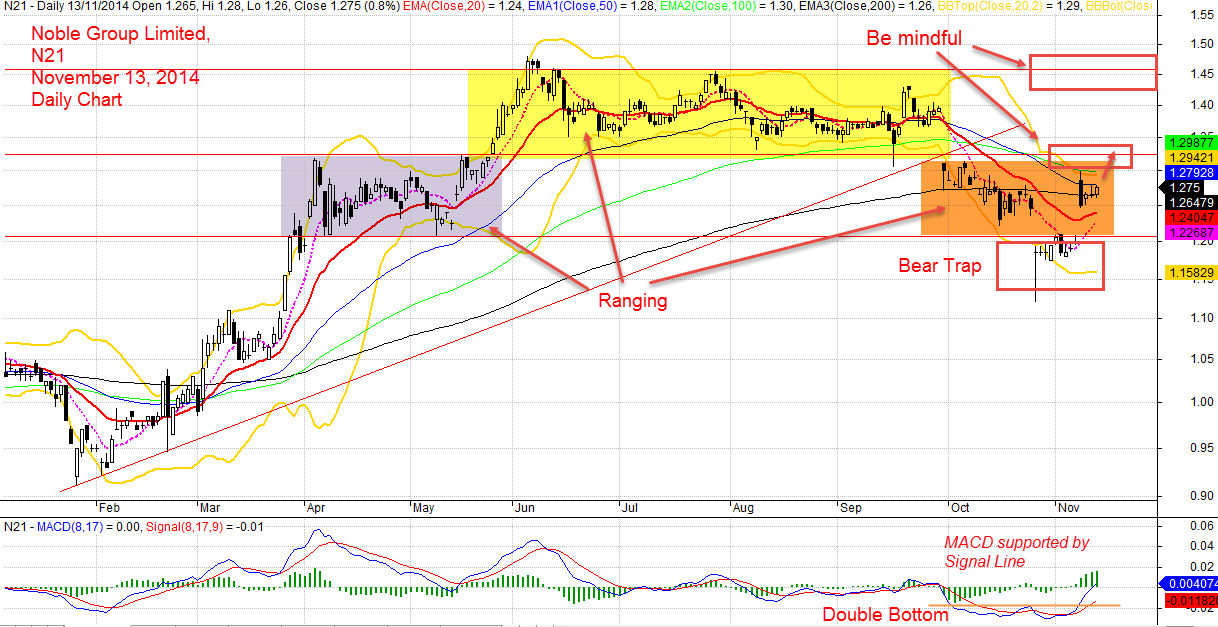
Noble Group Limited, N21 November 13, 2014 Daily Chart
Chart worth a thousand words, see COSMOSTEEL HOLDINGS LIMITED why top volume on bearish bias.
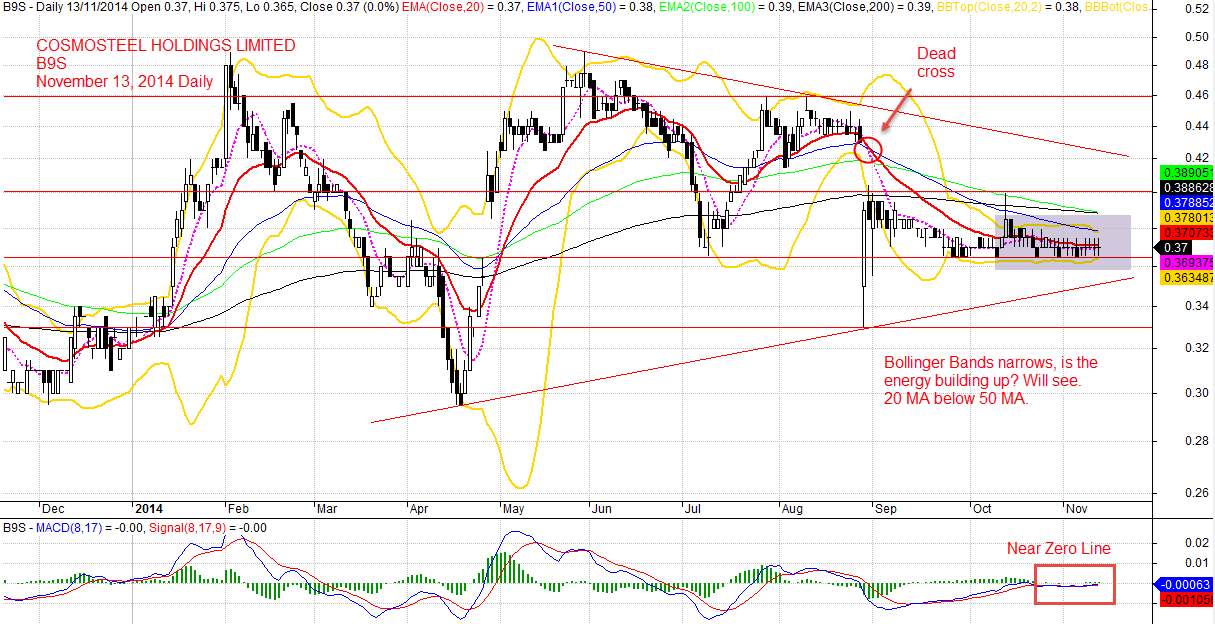
COSMOSTEEL HOLDINGS LIMITED, B9S November 13, 2014 Daily
To read more on other posting:
1) Stock Analysis – Noble Group Limited, N21
2) Moving Average Convergence Divergence (MACD), October 28, 2014
3) Where are markets headed? C52.SI
Stock trading is not a get rich quick scheme.
Thanks for visiting the site, AmiBrokerAcademy.com.
Moses
DISCLAIMER
Information provided here is of the nature of a general comment only and no intend to be specific for trading advice. It has prepared without regard to any particular investment objectives, financial situation or needs. Information should NOT be considered as an offer or enticement to buy, sell or trade.
You should seek advice from your broker, or licensed investment advisor, before taking any action.
Once again, the website does not guarantee any results or investment return based on the information and instruction you have read here. It should be used as learning aids.
Trading is personal. You are responsible for your own trading decision.
The comment is the author personal experience. There is no intent for your believe and follow.