Moses’s Singapore Stock Market Analysis, Neptune Orient Lines, NOL Update, Sideways?
It is exactly one month ago. I suggest we should wait for the pattern to complete before we conclude the price action. We have seen the price stop travel north and resisted at $1.50. Subsequently the price was hovering and retested $1.460 a few times. The price was supported at $1.330. The price is sideways and bouncing between $1.330 and $1.460 since then.
With the current sentiment that the market is not at NOL advantage, the sideways may stay.
Interested to know what I suggest a month ago. See the earlier posting for the last comment.
Neptune Orient Lines, NOL, N03 Daily Chart
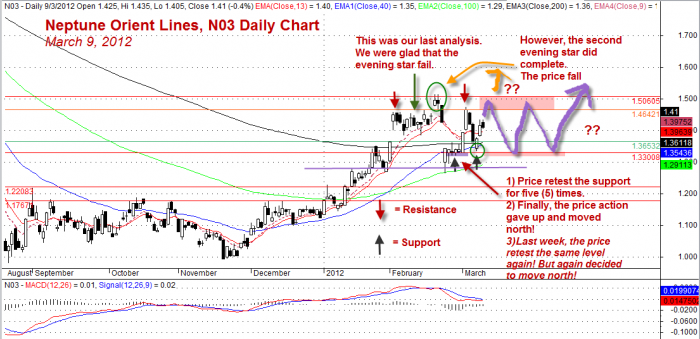
Neptune Orient Lines, NOL, N03 Daily Chart, March 9, 2012
It is a good practice to assess your stock every few months. The objective is to understand the market characteristic and make two decisions, either continue to hold or exit soon. Trade with caution!
Welcome to Moses’s Singapore Stock Analysis at AmiBrokerAcademy.com. Thank you for visiting the site. You are here because you want to know why the stock moves or when the stock will move in the near future.
By Moses March 11, 2012
DSICLAIMER
Information provided here is of the nature of a general comment only and no intend to be specific for trading advice. It has prepared without regard to any particular investment objectives, financial situation or needs. Information should not be considered as an offer or enticement to buy, sell or trade.
You should seek advice from your broker, or licensed investment advisor, before taking any action.
Once again, the website does not guarantee any results or investment return based on the information and instruction you have read here. It should be used as learning aids only and if you decide to trade real money, all trading decision should be your own.
Leave a Reply
You must be logged in to post a comment.